Bonus: Supervised and Unsupervised Land Cover Classification in QGIS and ArcGIS Pro#
In this lab, we will conduct supervised and unsupervised land cover classifications of Landsat satellite imagery. Unsupervised classifications rely entirely on algorithms to classify differences in land cover. Supervised classifications instead use training data to define land cover types that assist the algorithm to classify land cover. Unsupervised classifications are generally not advisable unless the researcher has minimal understanding of the area of interest or is trying to parse out additional detail in land cover variation.
Unsupervised Classification in QGIS#
In QGIS, under Plugins, install the Semi-Automatic Classification Plugin and restart QGIS. If you receive an error message, you may need to upgrade some dependencies. If so, open the OSGEO4W Shell and run the following command:
pip3 install --upgrade remotior-sensus scikit-learn torch
After restarting QGIS, an SCP toolbar should now be available.
We are going to conduct an unsupervised classification of land cover using the composite from the previous lab.
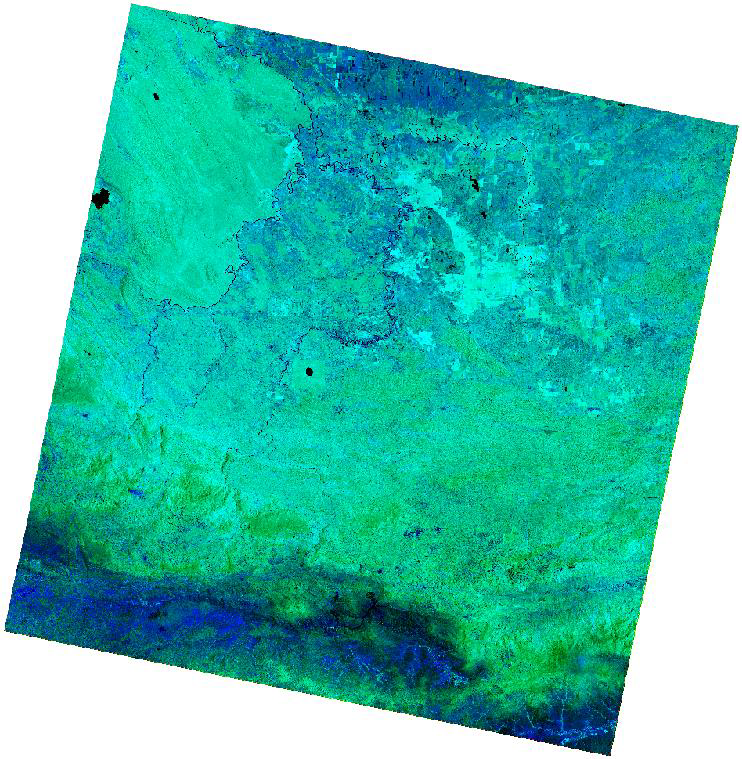
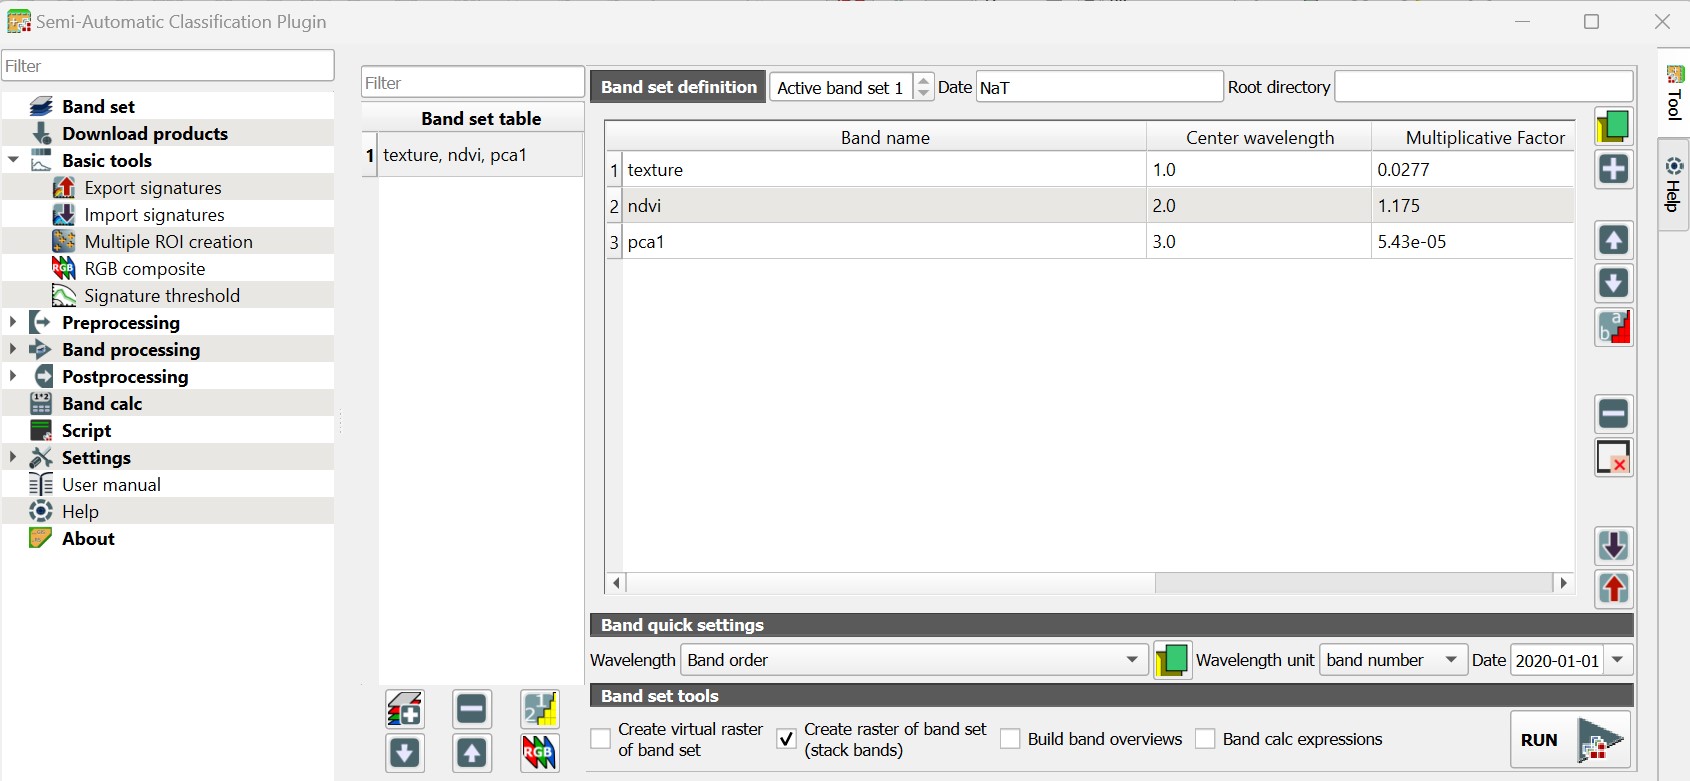
To create this composite in the SCP plugin, open the Band Set section of the plugin. Add, in order, the texture (variance of the first order PCA) surface, the NDVI, and the first order PCA. Ensure that all of these files have the same spatial reference and the same bit depth. If necessary, use the Assign Projection tool to change the spatial reference, and use the GDAL Raster Calculator to change the bit depth (using the expression A * 1.0 to keep values the same). We also need to make sure we weigh the bands properly – they have significantly different data ranges. Right click each of the rasters/bands in Layers, and navigate to Properties -> Information. Take note of the value next to STATISTICS_MEAN. Under multiplicative factor, enter the value equal to 1/STATISTICS_MEAN for each band.
Under Band set tools, you can also export your multiband image as a virtual raster or as a locally saved raster. When viewing the multiband image in QGIS, you may need to set the Symbology to an Updated canvas, zoom in slightly, then change Symbology to Current canvas.
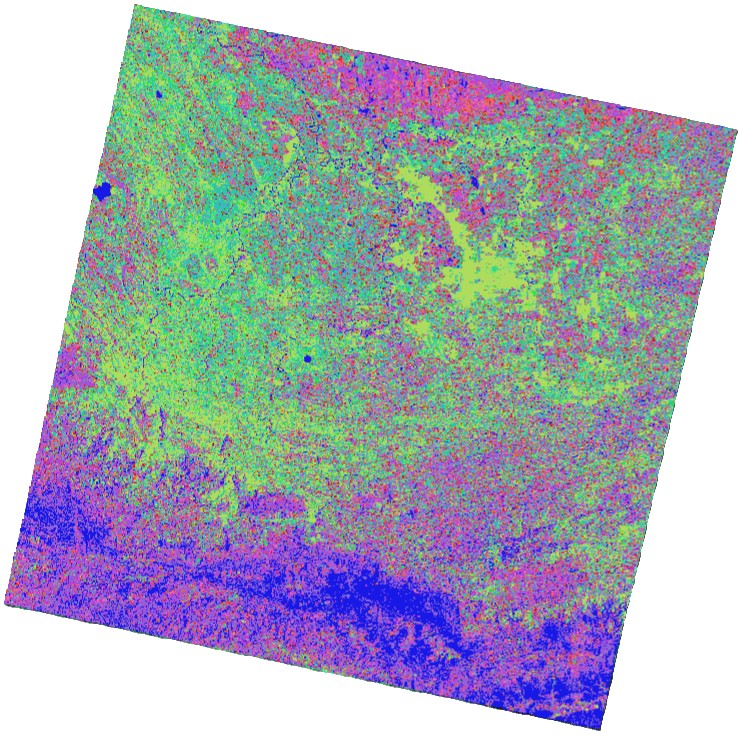
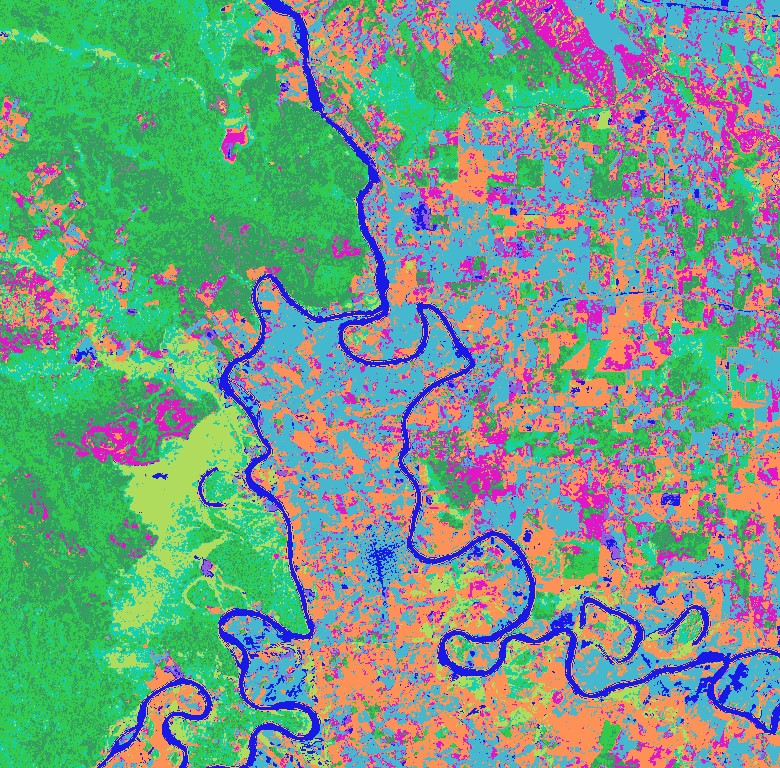
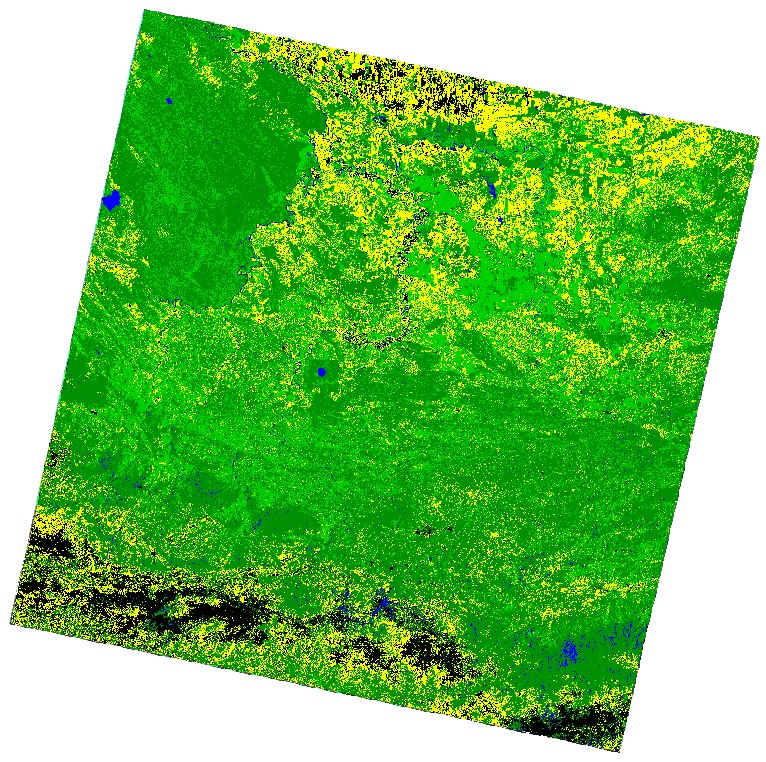
Under Band processing, select Clustering, change Number of classes to a desired value, and change Seed signatures to Use random seed signatures. The following is an unsupervised classification using 11 clusters:
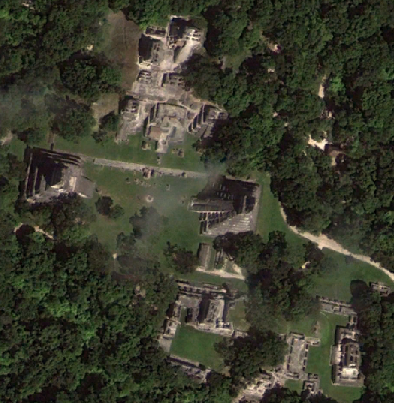
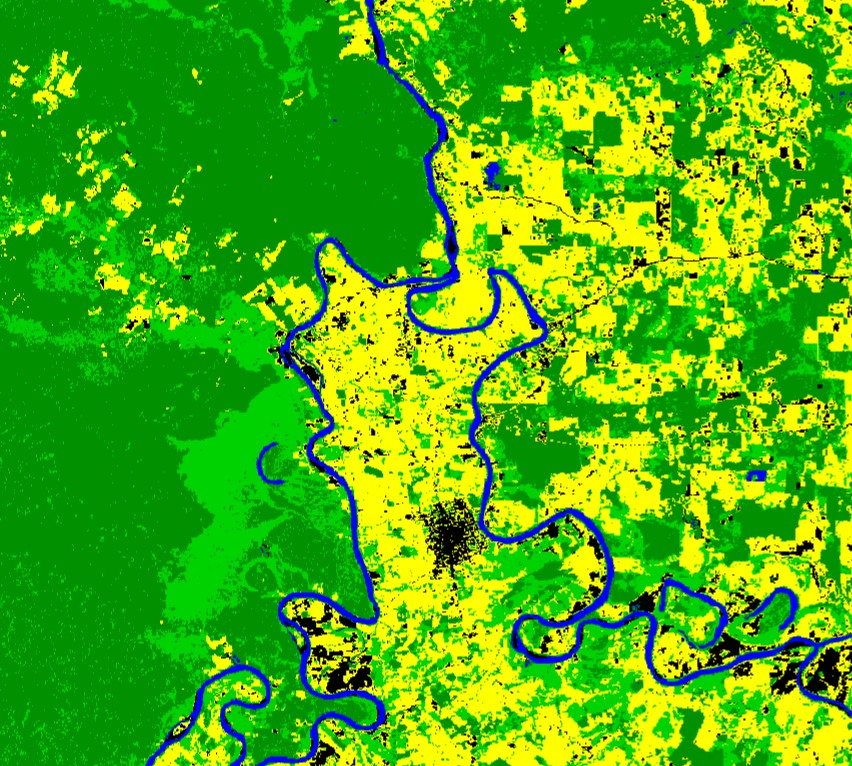
We can see better detail zoomed in:
The classification seems to have identified water, forest cover, and certain types of agriculture, but the results are inconsistent.
Unsupervised Classification in ArcGIS Pro#
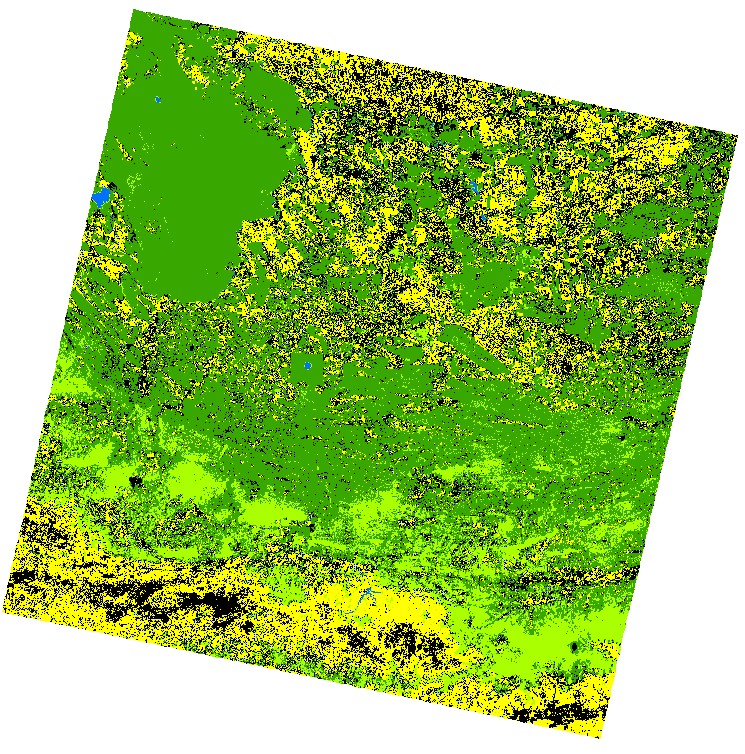
In ArcGIS Pro, navigate to Imagery -> Classification Wizard. Under Classification Method, select Unsupervised, Classification Type Pixel based, use default classification schema (this will assign default land cover classes), and select an output location. In the next window, define 11 Maxinum Number of Classes. After running the algorithm, our results are similar to the unsupervised classification in QGIS:
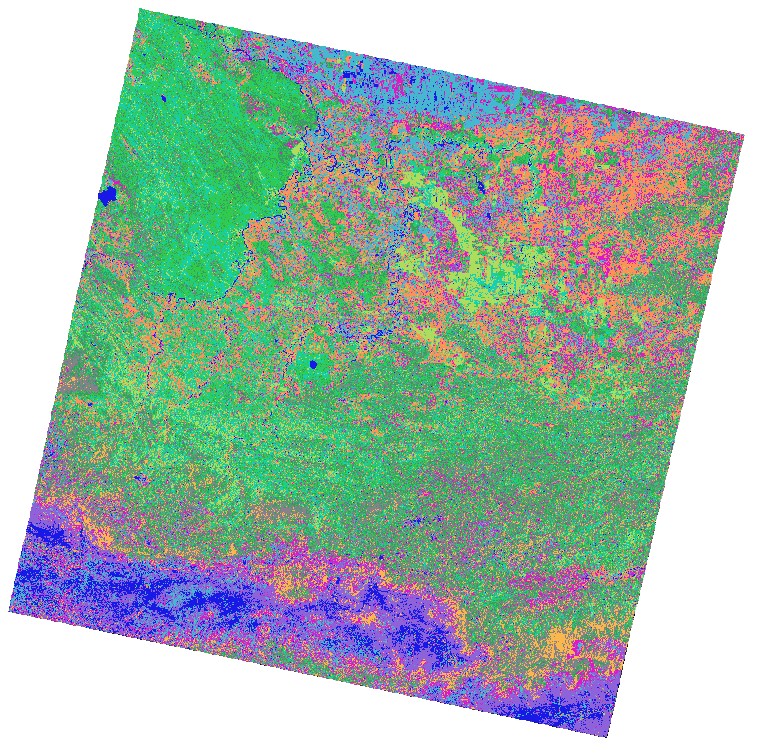
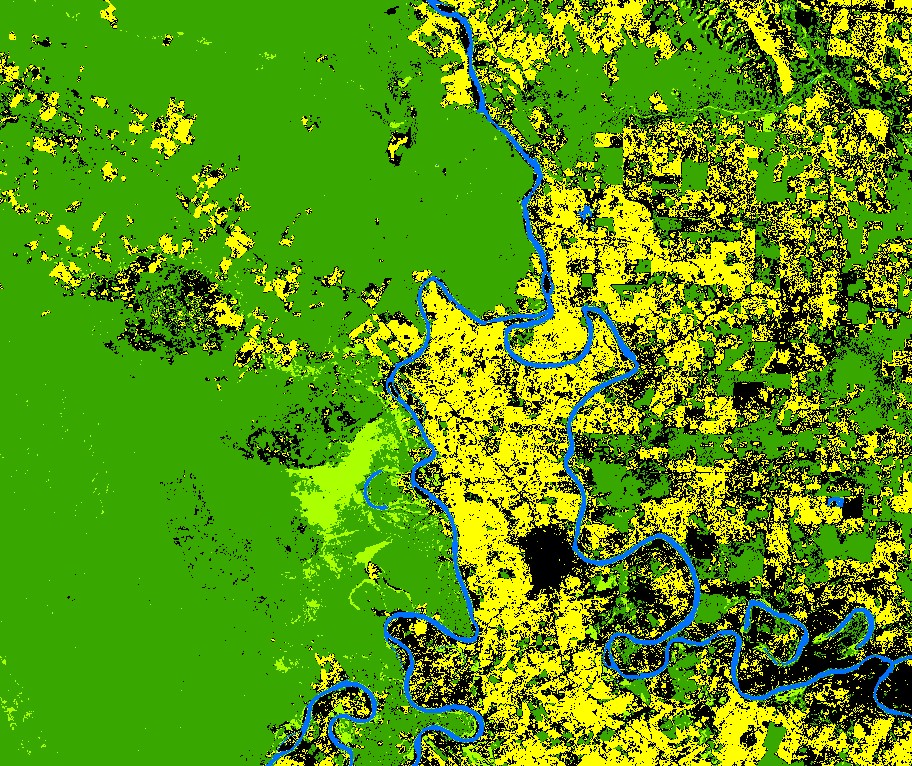
And zoomed in:
A notable issue is that the unsupervised algorithm is classifying shaded areas into unique classes. The algorithm is therefore not recognizing the variability within classes. A supervised classification will be necessary to train the algorithm to recognize these qualities of the landscape.
Supervised Classification in QGIS#
For the supervised classification, we will simplify the inputs. Create a new band set in the SCP plugin, and add Bands 1-7 and 9. They are all scaled the same, no need to weigh them. Note that we could optionally enter the multiplicative and additive scale factors to convert to reflectance. Create a virtual raster and visualize the imagery. Minimize the window and open the SCP Dock (under View -> Panels).
In the SCP Dock, click on Training input and then the Create a new training input button. Save your file, then in the SCP Working Toolbar click on the Create a ROI polygon button. Draw an ROI polygon over water, for example. Change the C Name to Water, and then click the save button. Now continue with Forest, followed by any other desired classes.
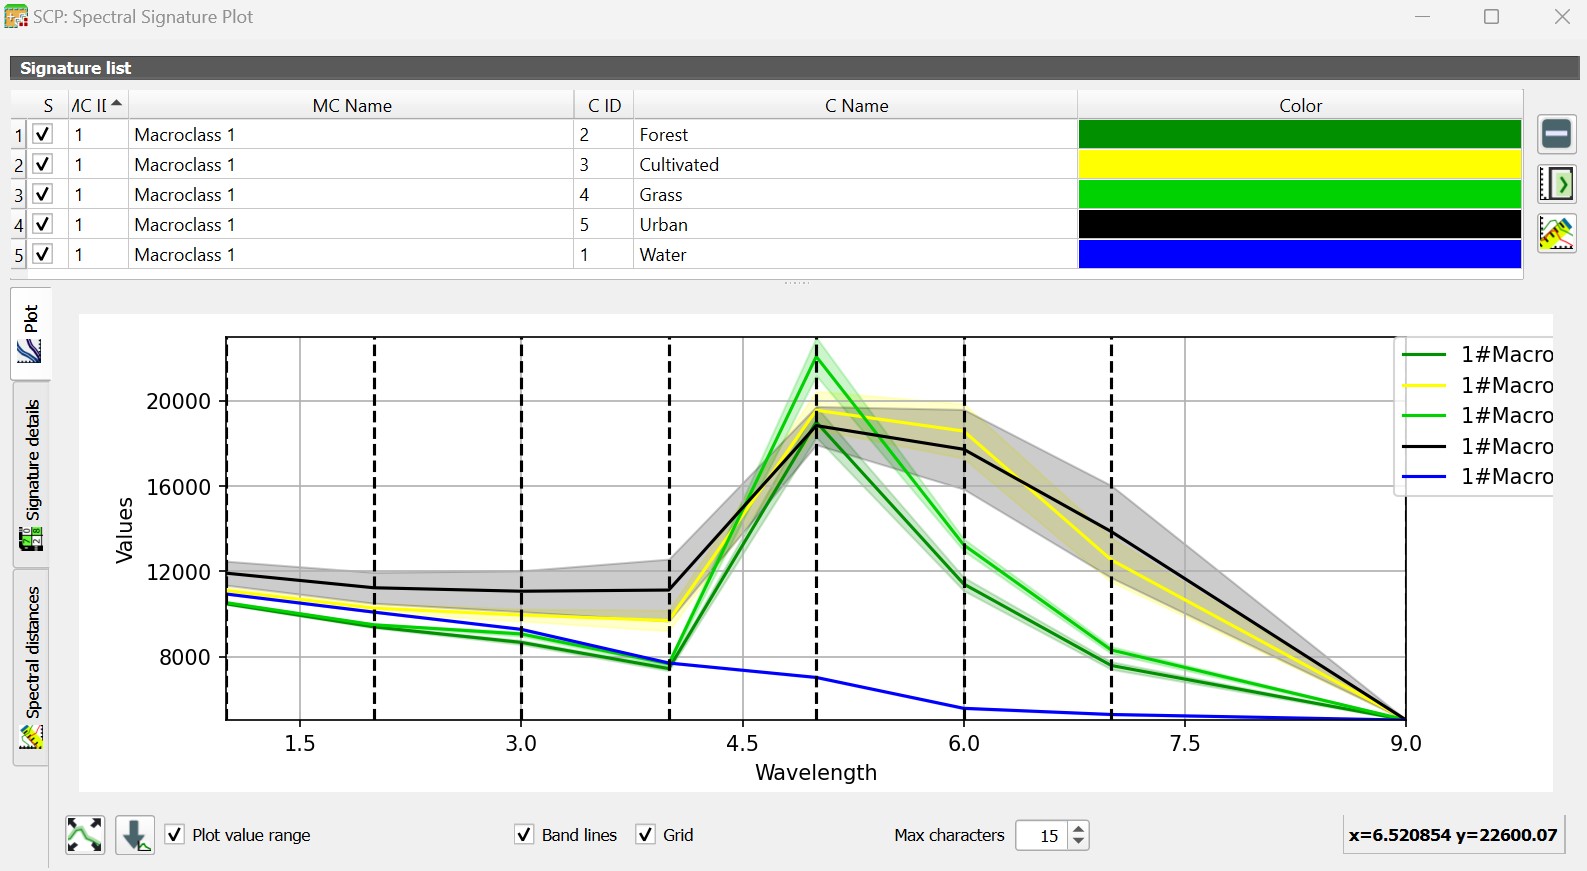
When done, highlight all classes in the table in the SCP Dock and click the Calculate signatures for highlighted items button. Highlight the items again and click on the Add highlighted signatures to spectral signature plot button. The following graph shows the spectral signatures of our defined classes.
Next, we return to the SCP plugin menu and click on Classification, under Band Processing. Select the input band set, use training data from Class ID, and select the Minimum Distance algorithm. Click Run.
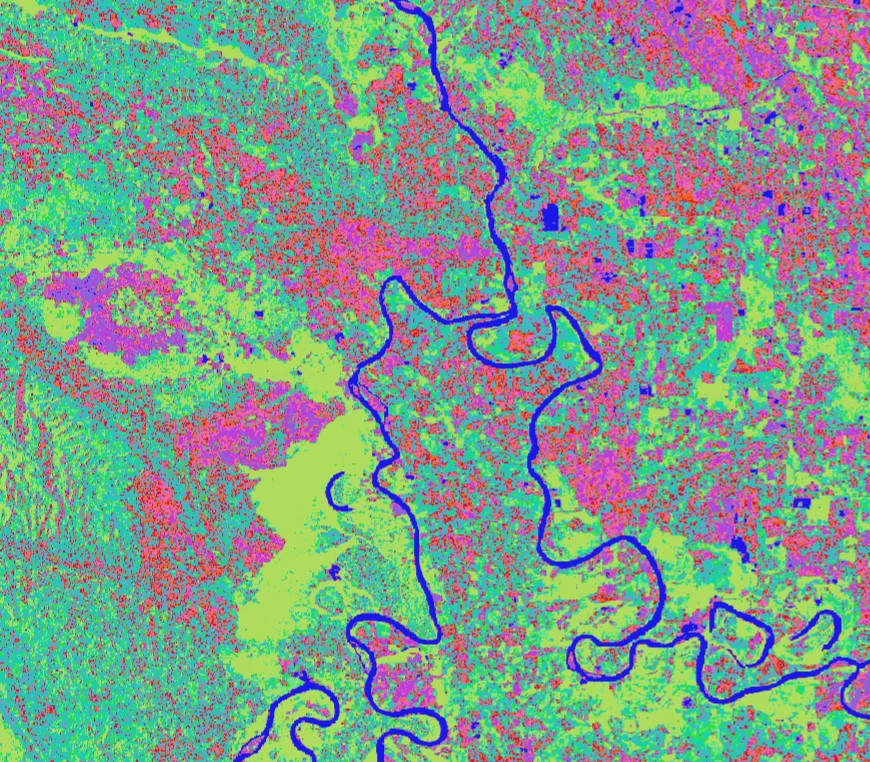
We now have a classified map:
Overall, this classification is more meaningful than the unsupervised classification. The algorithm was able to define broad land cover categories. The southern part of the area of interest is not classified as well, so we may want to develop an alternate classification scheme for that area.
Supervised Classification in ArcGIS Pro#
In ArcGIS Pro, select your multiband imagery in Contents, and navigate to Imagery -> Classification Tools -> Training Samples Manager. Draw training polygons for each land cover class and save. Navigate to Imagery -> Classification Wizard. Select Supervised classification, pixel-based, and Generate from training samples the Classification schema, selecting your training polygons. Choose a K-Nearest Neighbor classifier and run the tool to generate a land cover map:
This classification was not as successful as the previous supervised classification in QGIS, but it could be improved with additional training polygons.
In the next lab, we will improve significantly on these techniques by leveraging Google Earth Engine.
References#
Brondízio, Eduardo S. and Rinku Roy Chowdhury. 2010. Spatiotemporal Methodologies in Environmental Anthropology: Geographic Information Systems, Remote Sensing, Landscape Changes, and Local Knowledge. In Environmental Social Sciences: Methods and Research Design, edited by Ismael Vaccaro, Eric Alden Smith, and Shankar Aswani, pp. 266-298. Cambridge University Press, Cambridge. https://doi.org/10.1017/CBO9780511760242.014
Jiang, Hong. 2003. Stories Remote Sensing Can Tell: Integrating Remote Sensing Analysis with Ethnographic Research in the Study of Cultural Landscapes. Human Ecology 31(2):215-232. PDF
Morrison, Kathleen D. et al. 2021. Mapping Past Human Land Use Using Archaeological Data: A New Classification for Global Land Use Synthesis and Data Harmonization. PLoS One 16(4):e0246662. https://doi.org/10.1371/journal.pone.0246662