4. Drone Mission Planning for Photogrammetry#
This lab teaches students how to plan drone flights for photogrammetric production of digital surface models and orthorectified aerial imagery. Although several examples of automated drone mission planning software and apps exist (e.g. Pix4Dcapture, Drone Deploy, Map Pilot Pro), remote pilots should understand the methods and math behind drone mission planning for photogrammetry.
Camera Settings#
To acquire quality imagery, keep note of your camera settings. Taking a single photo from a static drone is relatively simple, but when acquiring imagery over a large survey area, keep in mind that the drone is moving while it takes the photos. A conservative approach would be to program the drone to fly a specified path and to come to a full stop at set waypoints before taking photos. This approach reduces battery life and is not always necessary. Quality imagery can be taken from a moving drone, but an effort must be made to reduce blur.
Generally, drones equipped with mechanical rather than electronic/rolling shutters are more suitable for reducing blur. A mechanical shutter exposes all parts of the sensor to light at the same time, whereas a rolling shutter exposes the sensor to light each line of pixels from top to bottom at a time. Rolling shutters may also introduce added distortion. Note that quality imagery for mapping purposes can be acquired with rolling shutters, but added effort must ensure that blur is reduced elsewhere.
Another way to control blur is with shutter speed. Measured as a fraction, smaller values (measured in seconds) represent faster shutter speeds. A faster shutter speed is suitable for moving targets to reduce blur, faster than 1/1000, for example. However, increasing the shutter speed has adverse effects on other camera settings. The exposure triangle is a useful model to understand how camera settings affect the quality of the photo.
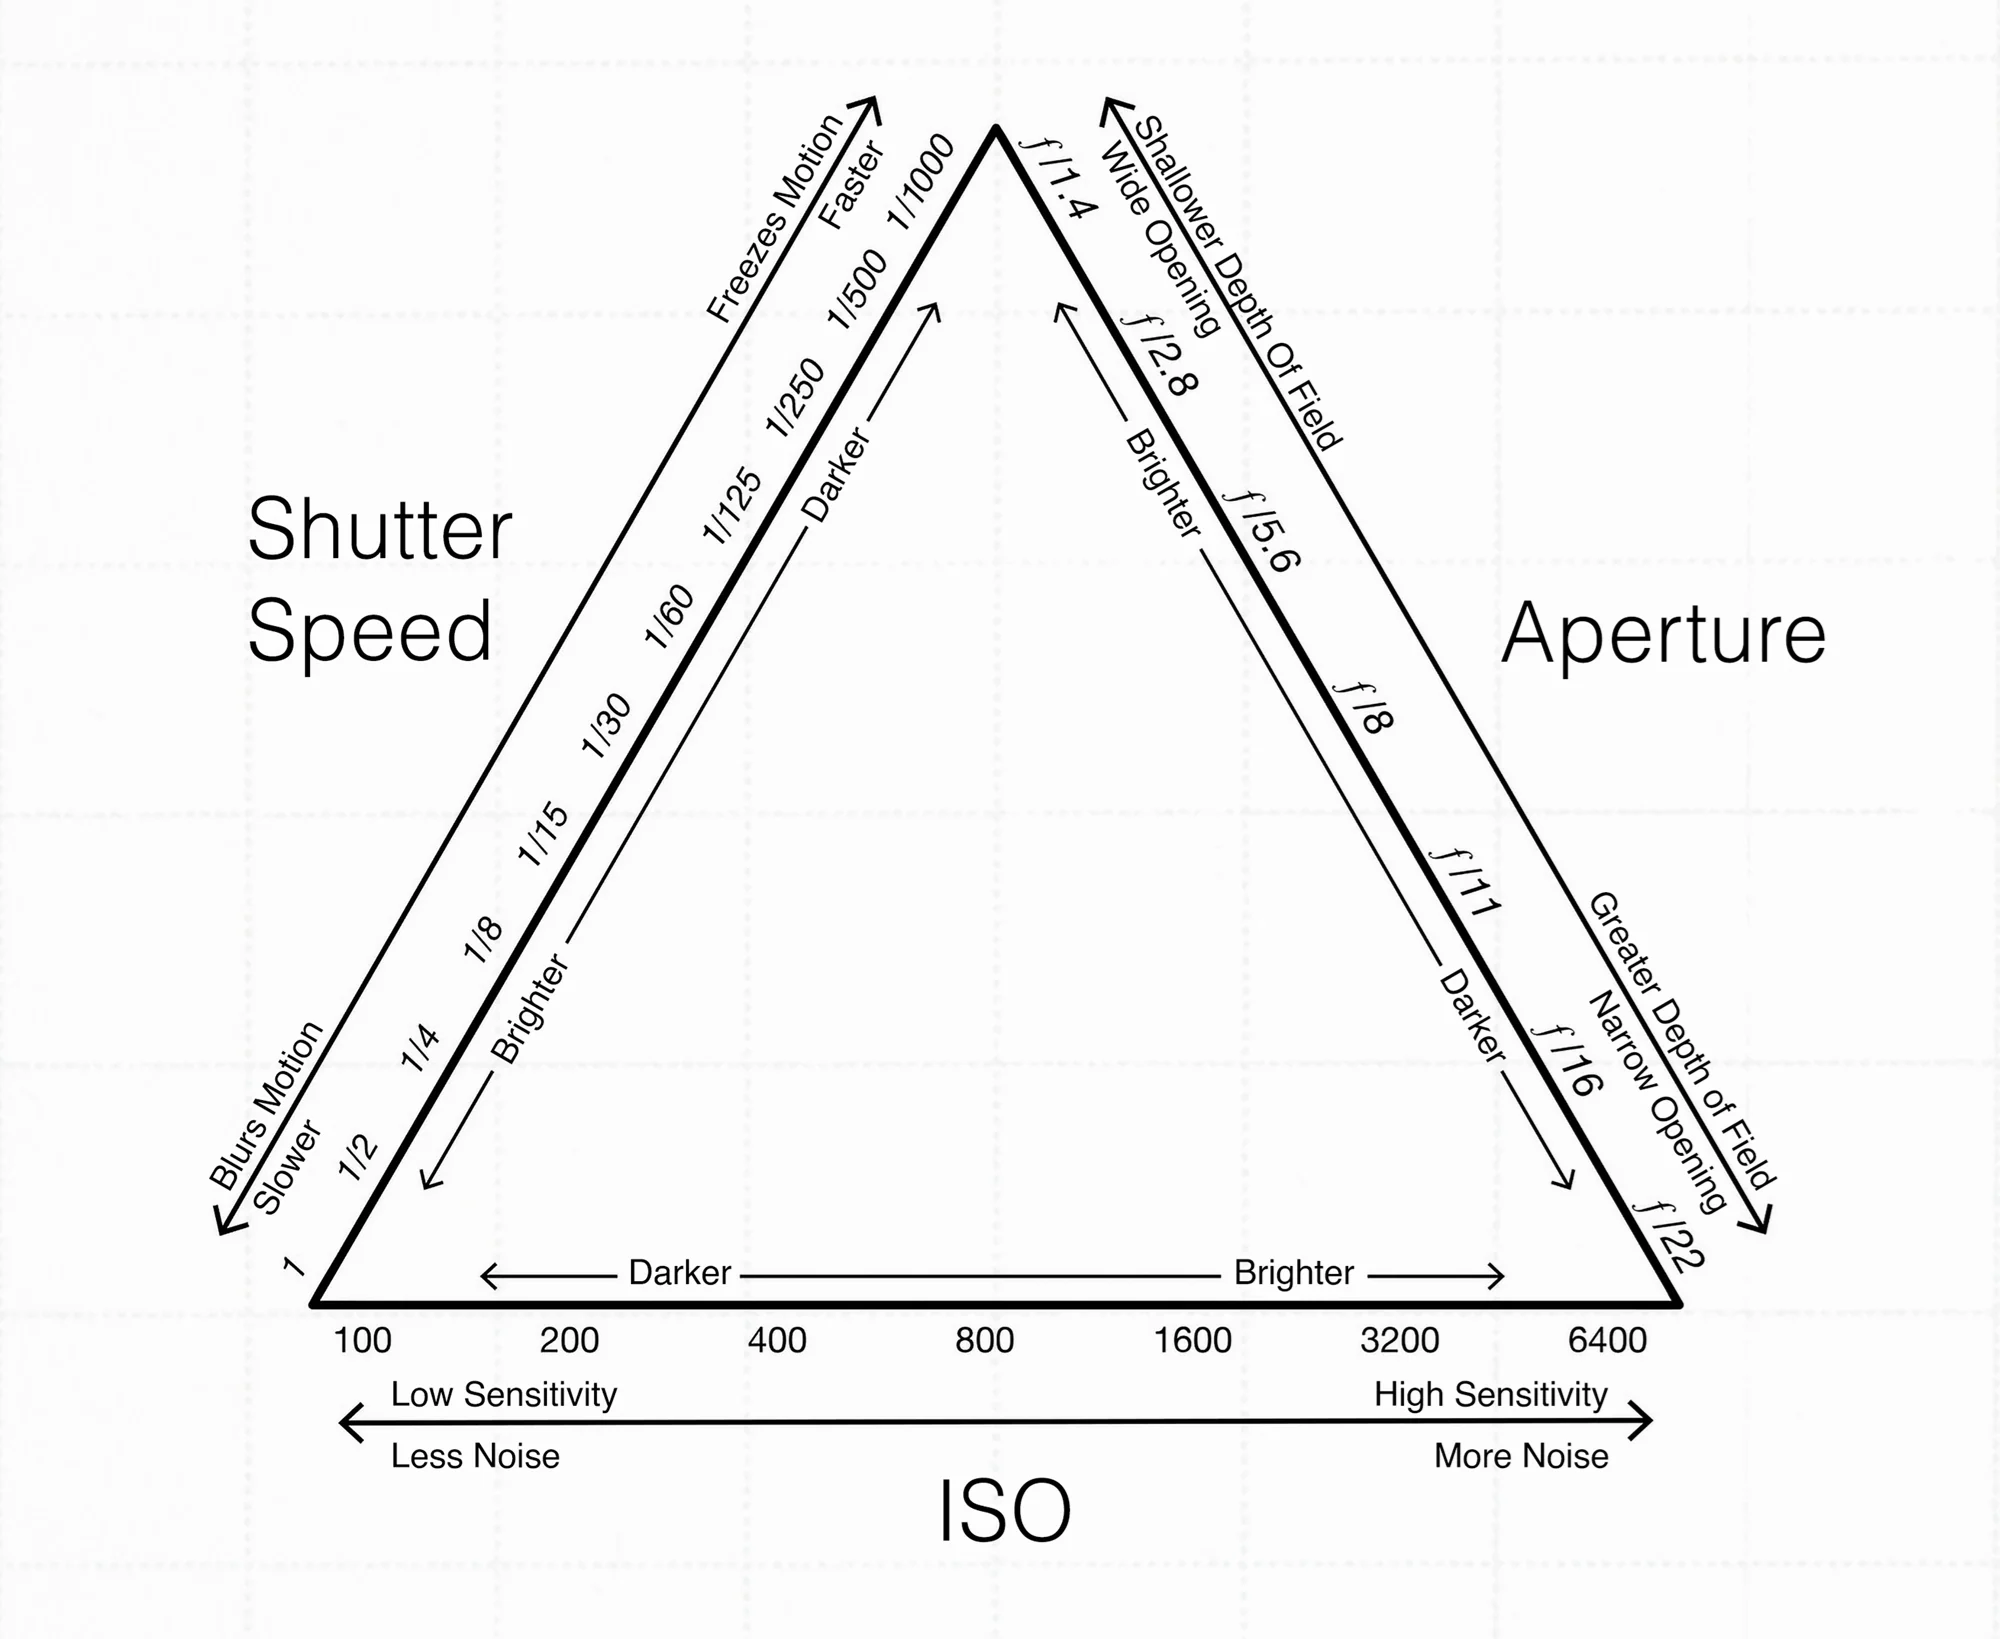
Image credit: Papadopavlos
A faster shutter speed allows less light to reach the sensor, leading to a darker, underexposed image. We can compensate by adjusting other settings, including aperture and ISO. Aperture refers to the size of the opening in the lens, measured as an f-stop, also a fraction. The smaller the denominator of the f-stop the wider the opening and the larger the denominator of the f-stop the smaller the opening. A wider aperture will let in more light compared to a smaller aperture. Additionally, aperture affects the depth of field, determining what parts of a photo will be in focus, with smaller apertures having greater depths of field and larger apertures having shallower depths of field. For drone mapping, we want the whole landscape to be in focus, so we want a greater depth of field. In general an f-stop of f/8 or lower is preferred. Finally, ISO is a measure of the sensitivity to light (previously determined by the type of film used and now integrated into digital cameras.) A lower ISO is less sensitive to light, while a higher ISO is more sensitive. A higher ISO will therefore allow more light to hit the sensor. However, lower ISO numbers create sharper images, while higher ISO numbers introduce noise. Ideally, for drone imagery, you will not want an ISO higher than 200 or 400.
On a clear sunny day, the automatic settings on your camera will likely be sufficient. However, keep an eye on these settings and adjust manually if necessary, especially if flying in overcast or dark conditions.
Ground Sampling Distance#
A critical concept in drone mission planning is ground sampling distance (GSD). Ground sampling distance refers to the scale and resolution of aerial imagery and resulting digital surface models. Specifically, the ground sampling distance is the pixel or cell size of the raster imagery, in other words, the equivalent ground distance from the center of one cell to the next. The cell size is equivalent to the resolution of the imagery.
Ground sampling distance ultimately depends on the flight altitude of the drone. Lower flights (where the camera is closer to the ground) result in higher resolutions, while higher flights (where the camera is farther from the ground) result in lower resolution. Other variables needed to calculate ground sampling distance include the size of the camera sensor and the focal length of the camera. In photography, the focal length of a camera refers to the distance between the camera sensor and the lens. A higher focal length results in a higher magnification (higher zoom level).
The image below shows how the ground distance can be calculated:
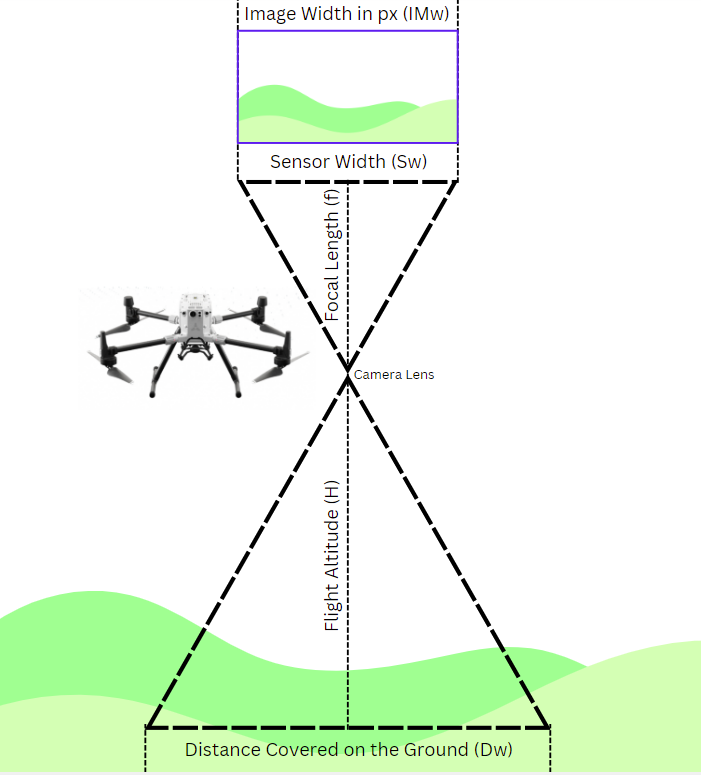
Image credit: Skycatch
Of course, this image is not to scale, but the above exaggeration demonstrates that the ground distance covered in a single drone image can be calculated based on the Triangle Proportionality Theorem, shown by the following formula:
Because drone photos are typically in landscape orientation, the width is larger than the height. For this reason, sensor width (sensor size) and distance width are typically used to calculate ground sampling distance (although the math still works when sensor height and distance height are used).
We can then derive the following formula:
Finally, distance covered can be translated into ground sampling distance (cell size) by dividing distance covered by the image width of the photo in pixels.
Flight Altitude is user defined, but all other constants depend on drone specifications, which can be difficult to find. An online GSD calculator with drone specifications is available here.
Oblique Imagery#
The above equation applies only to nadir imagery, taken at a 90° angle from the front of the drone, where on a flat plane all pixels will have the same dimensions. When taking oblique imagery, between 0° and 90°, the imagery is distorted, effectively with pixels further away from the camera representing longer ground distances than those closer to the camera. Oblique imagery taken from the same altitude will therefore always have a lower resolution than nadir imagery.
Image credit: Hammer Missions
To determine ground resolution of oblique imagery, additional calculations are required, relying on basic trigonometry. Joachim Höhle has written a useful discussion of how to derive such calculations.
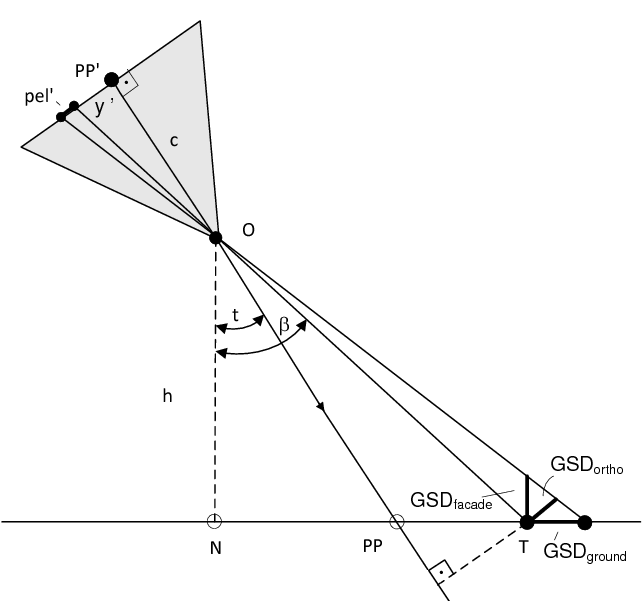
In this image, c represents the focal length (f), pel’ the sensor width (Sw), h the flight altitude (H), t the oblique angle of the camera (measured not from the front of the drone but rather from the vertical, i.e. subtracting the camera angle from 90), PP the central pixel of the image, N the nadir point beneath the drone, PP’ the center of the camera sensor, y’ the distance between the center of the camera sensor and the pixel of interest for calculating GSD, and β the additional angle beyond the camera angle to reach the pixel of interest. Three different ground sampling distances are shown, the resolution relative to the orthogonal, a vertical facade, and the ground itself.
Imagery Overlap#
For drone photogrammetry, you must ensure that your photos have enough overlap to identify tie points. Front overlap refers to the amount of vertical overlap in your photos (height of the photo and direction the drone is flying), while side overlap refers to the amount of horizontal overlap in your photos (width of the photo and distance between flight transects). Generally, a key point or object must be visible in at least 3 photos for adequate modeling. A 50% overlap in one direction, therefore is not sufficient. Generally, 60-80% overlap should be sufficient – and side overlap can be slightly lower than front overlap if necessary. Nevertheless, a good guideline is 70% front and side overlap, which may need to be adjusted depending on flight conditions.
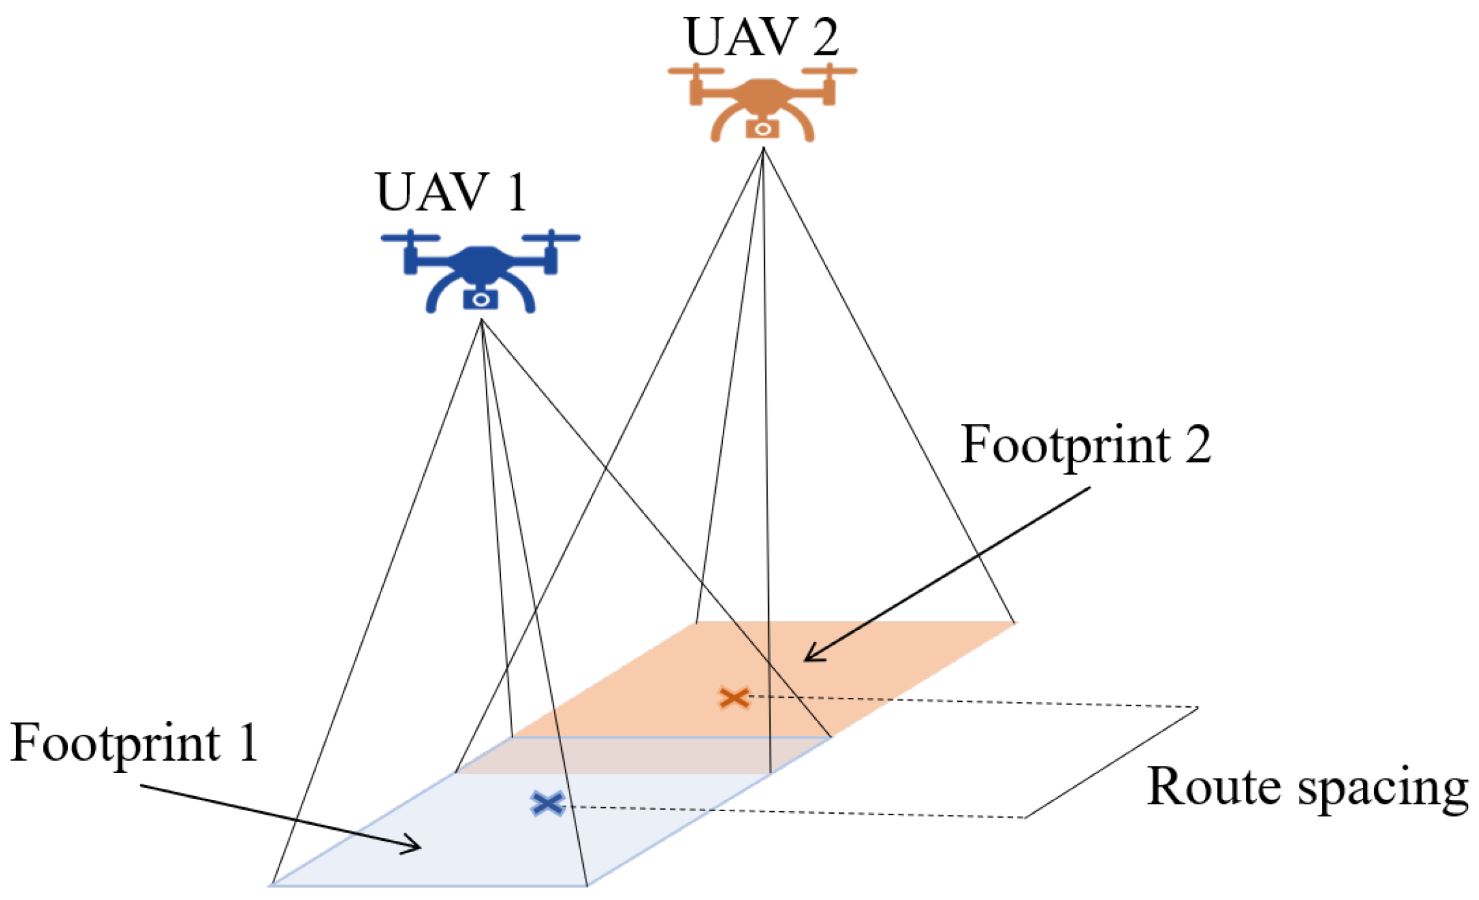
Image credit: Luna et al. 2022
Finally, flight overlap and drone altitude will affect the speed that the drone can fly while taking photos. The shutter speed is also a factor, but the effects are generally negligible at shutter speeds faster than 1/1000. A more significant factor is the photo interval, or the number of seconds between photos. A good rule of thumb is to allow 2 seconds between photos. To calculate drone speed, we need to know the dimensions of our photos, which we can calculate using ground sampling distance. This time, we use the height rather than the width of the photos because of the directionality of the flight.
For the desired overlap, the drone should not traverse the full Distance Covered (Dh) value but rather a fraction of that distance. For 70% overlap (or 0.7), we want the drone to traverse only 30% of the distance (or 0.3). Therefore,
A useful calculator is available here.
The final variable is the distance between transects. Here, we use the horizontal distance covered.
Drone Mission Planning in the QGIS Flight Planner#
Several plugins are available in QGIS for drone mission planning. The Flight Planner plugin requires drone camera specifications, an area of interest, and an optional terrain layer as input, and the plugin outputs a flight path with waypoints. These waypoints can then be uploaded to the drone, using for example the Litchi app.
The Flight Planner plugin can be installed under the Plugins menu. However, if working on a Mac, you may need to install additional dependencies. You will likely see an error that scipy is not installed. If so, find the location of your QGIS installation and verify where python is stored. The following folder path is the likely location. Open the Terminal on your Mac and type the following and press Enter:
/Applications/QGIS.app/Contents/Frameworks/lib/python -m pip install scipy matplotlib
Open QGIS and verify that you do not receive any error messages.
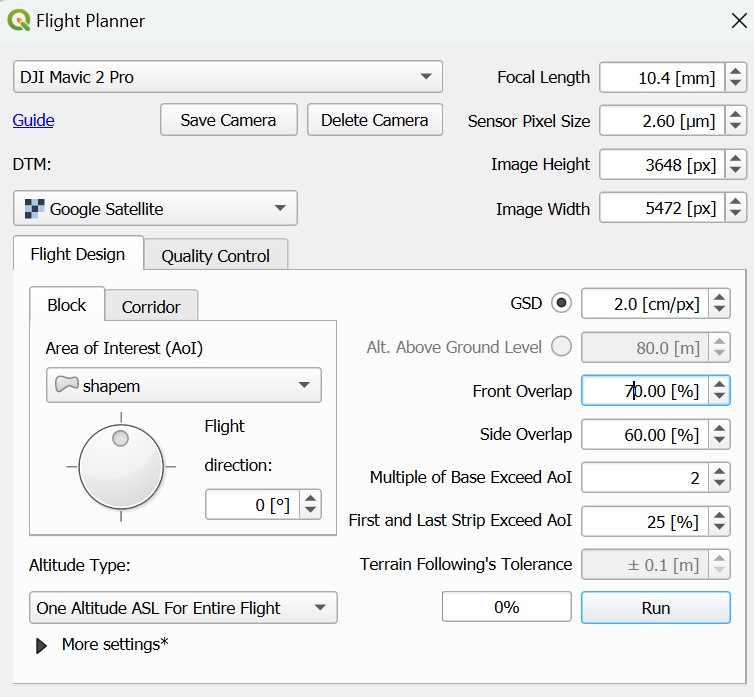
In the Flight Planner plugin, the input must be a polygon in a projected coordinate system, measured in meters, UTM, for example. Refer to the editing tools in QGIS or ArcGIS Pro to create polygons.
The Flight Planner menu is available under Plugins in QGIS. In addition to a polygon input, the plugin requires a DEM. The purpose of the DEM is to adjust waypoints based on terrain following. This feature is optional, as the plugin can assume a consistent above ground height. However, for the plugin to work, an input DEM is necessary regardless.
An SRTM elevation surface for the area of interest can be downloaded from USGS Earth Explorer. Note that if you want to use terrain following mode, you may need to reproject the SRTM to the same UTM system. The layer can be reprojected by using the r.proj tool.
After entering the specifications, click Run.
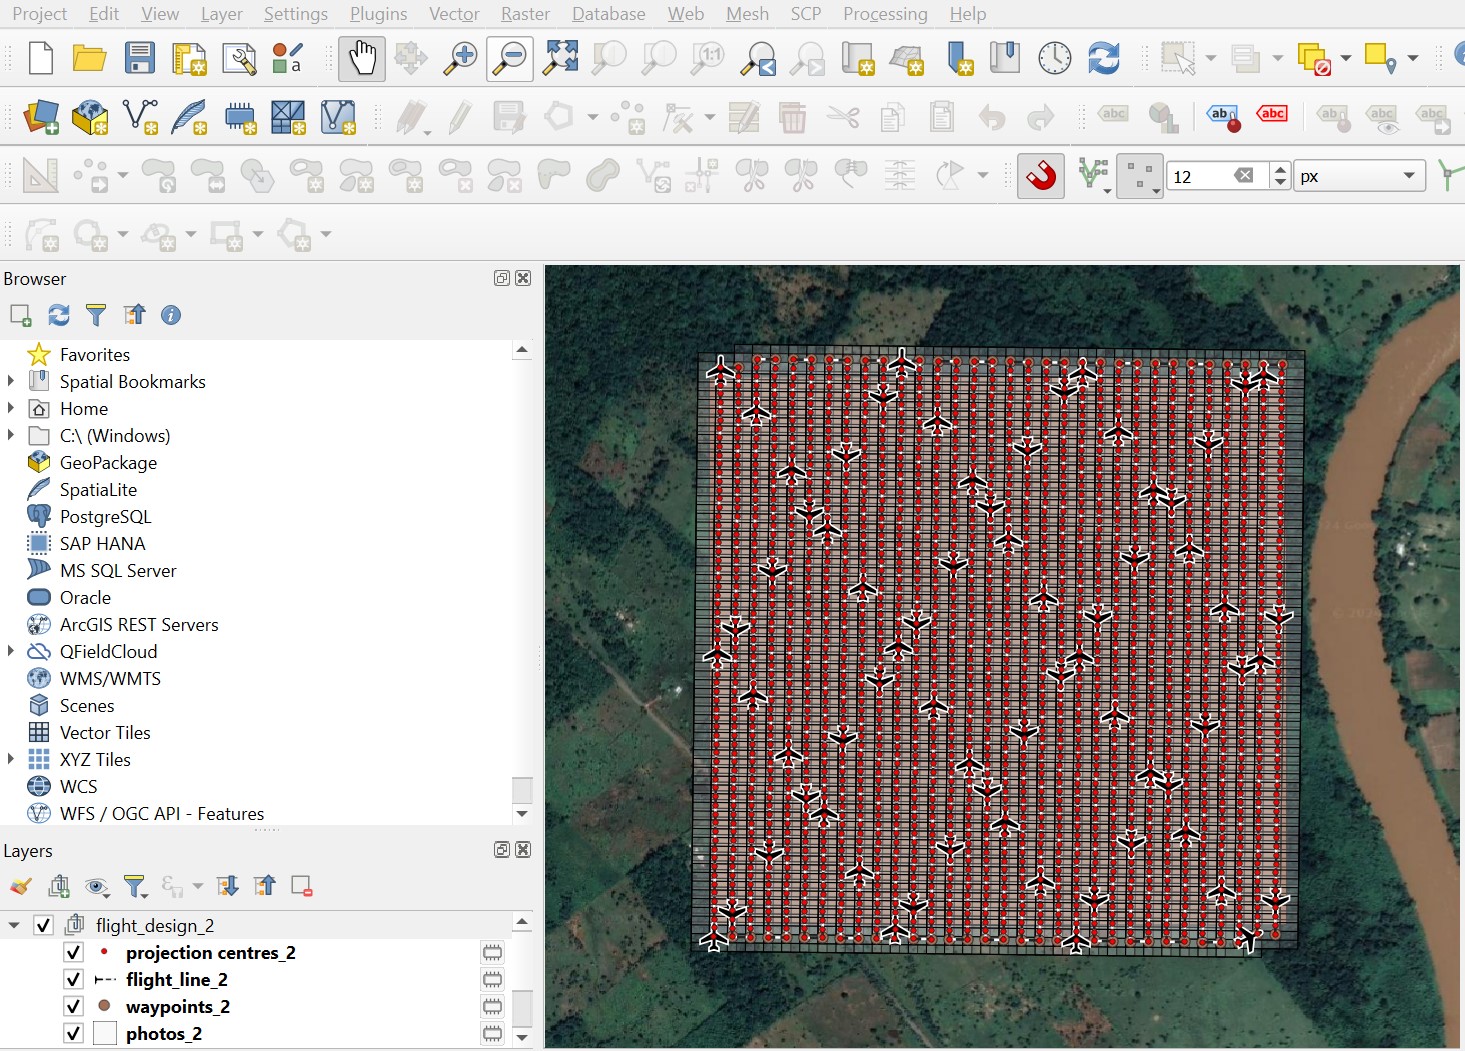
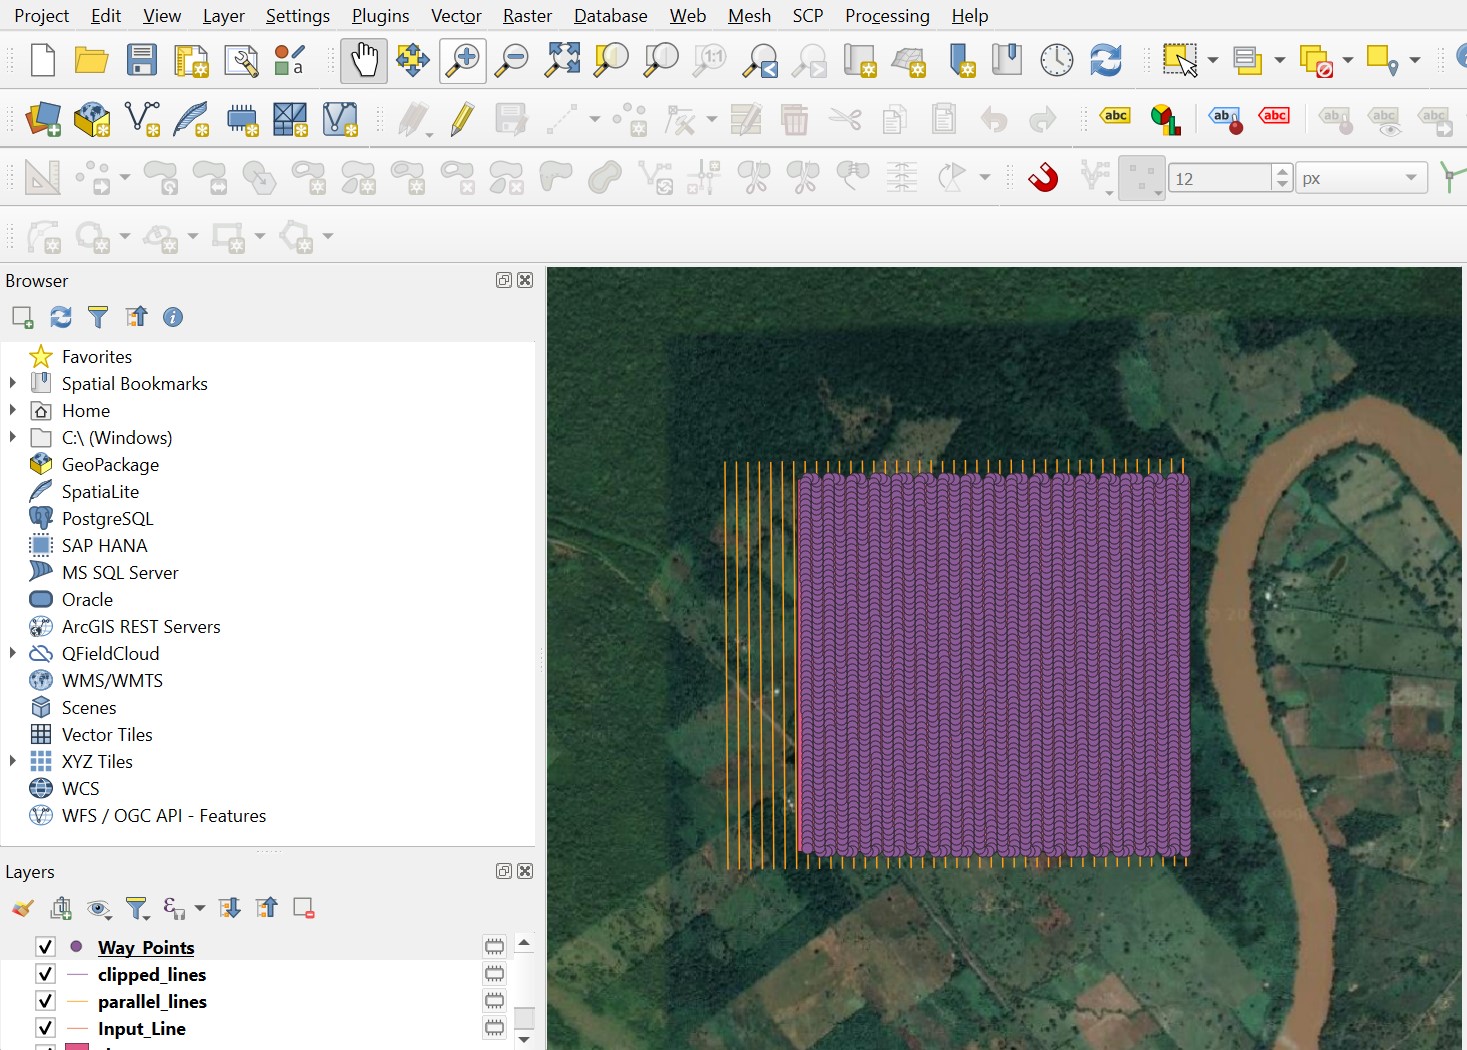
The plugin will produce the following transects:
You might receive an error regarding coordinate systems even if your data are correctly projected. This error can be ignored.
The waypoints file will include the GPS coordinates that can be uploaded to a flight app. Note that most flight apps will use latitude/longitude coordinates, while the Flight Planner plugin outputs to UTM. To add latitude/longitude to the attribute table, use Add X/Y fields to layer and specify the coordinate system as EPSG:4326. Then right-click the output table by right-clicking the new layer in the Contents and selecting Export -> Save vector layer as, and choose output file format as .csv.
GeoFlight Planner#
A better option might be the GeoFlight Planner plugin in QGIS. Once installed, the plugin is available under the GeoFlight Planner menu in QGIS.
First open the GSD and Overlap – Mission Calculator. Select a drone model or enter custom specifications. Click Save Drone Data to Flight Planner.
Several drop-down menus are available to calculate flight parameters. Click on Ideal Flight Speed Calculator. Enter the Flight Altitude, Shutter Speed, Frontal Overlap, and Min Shooting Interval, leaving other settings at their default. Click Calculate Optimal Speed. Take note of the Max Speed (Motion Blur) and Max Speed (Write Interval) values. Ideally, the Max Speed (Motion Blur) should be higher than the Max Speed (Write Interval). Adjust the shutter speed and recalculate if necessary. Flying at the Max Speed (Write Interval) should be fine. The recommended speed at the bottom is based on an arbitrary safety factor and should only be consulted if photos come out blurry when using the Max Speed (Write Interval).
When ready, exit out of the GSD and Overlap – Mission Calculator. Next, open GeoFlight Planner -> Horizontal Flight Plan -> Sensor. Load the polygon representing your area of interest. You will also need to draw a line representing the first flight line and direction. Use any coordinate system. Set Flight Height, Side Overlap, Forward Overlap, and Flight Speed (based on the result from the Ideal Flight Speed Calculator). Click Run.
The output attribute table will already have waypoint coordinates in latitude/longitude that can be uploaded to a drone.
Other QGIS Plugins#
Another option is the UAV Mapping Path Generator (for Litchi), which requires slightly different inputs to generate similar outputs.
Once the plugin is installed, the UAV Mapping Path Generator (for Litchi)/Drone Path is available under the Vector menu in QGIS. We use the following parameters, load an area of interest, and draw a line parallel to the desired transects when prompted.
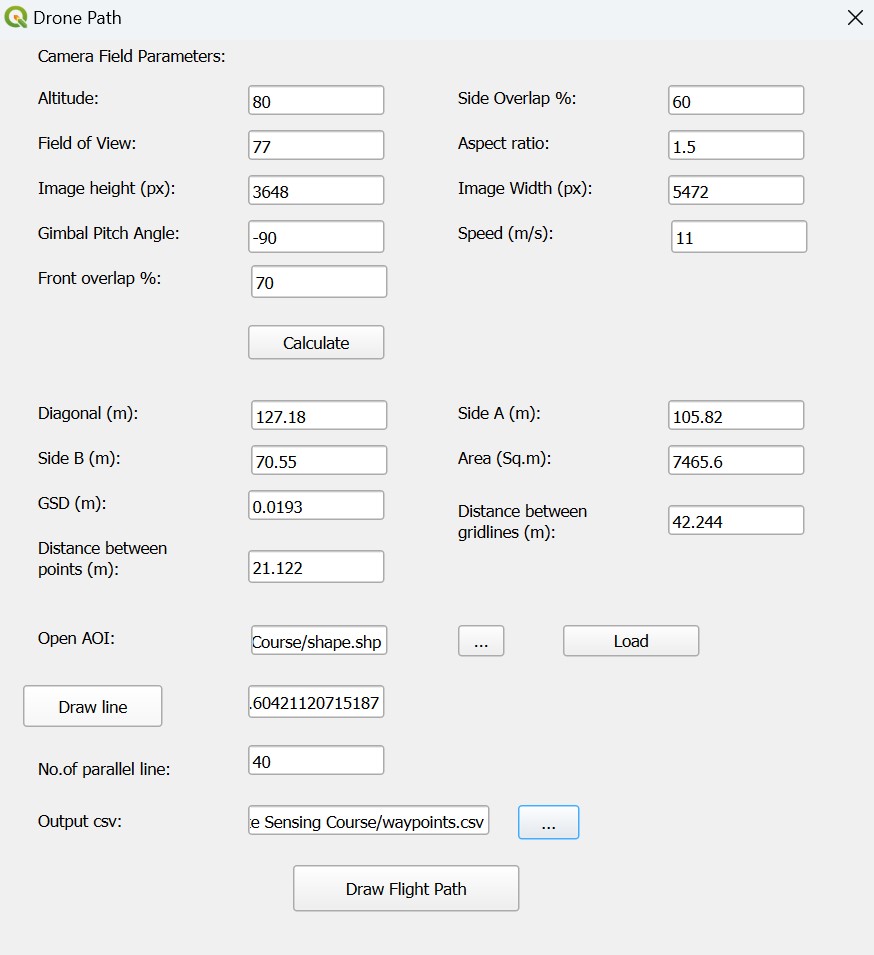
The plugin will produce the following transects:
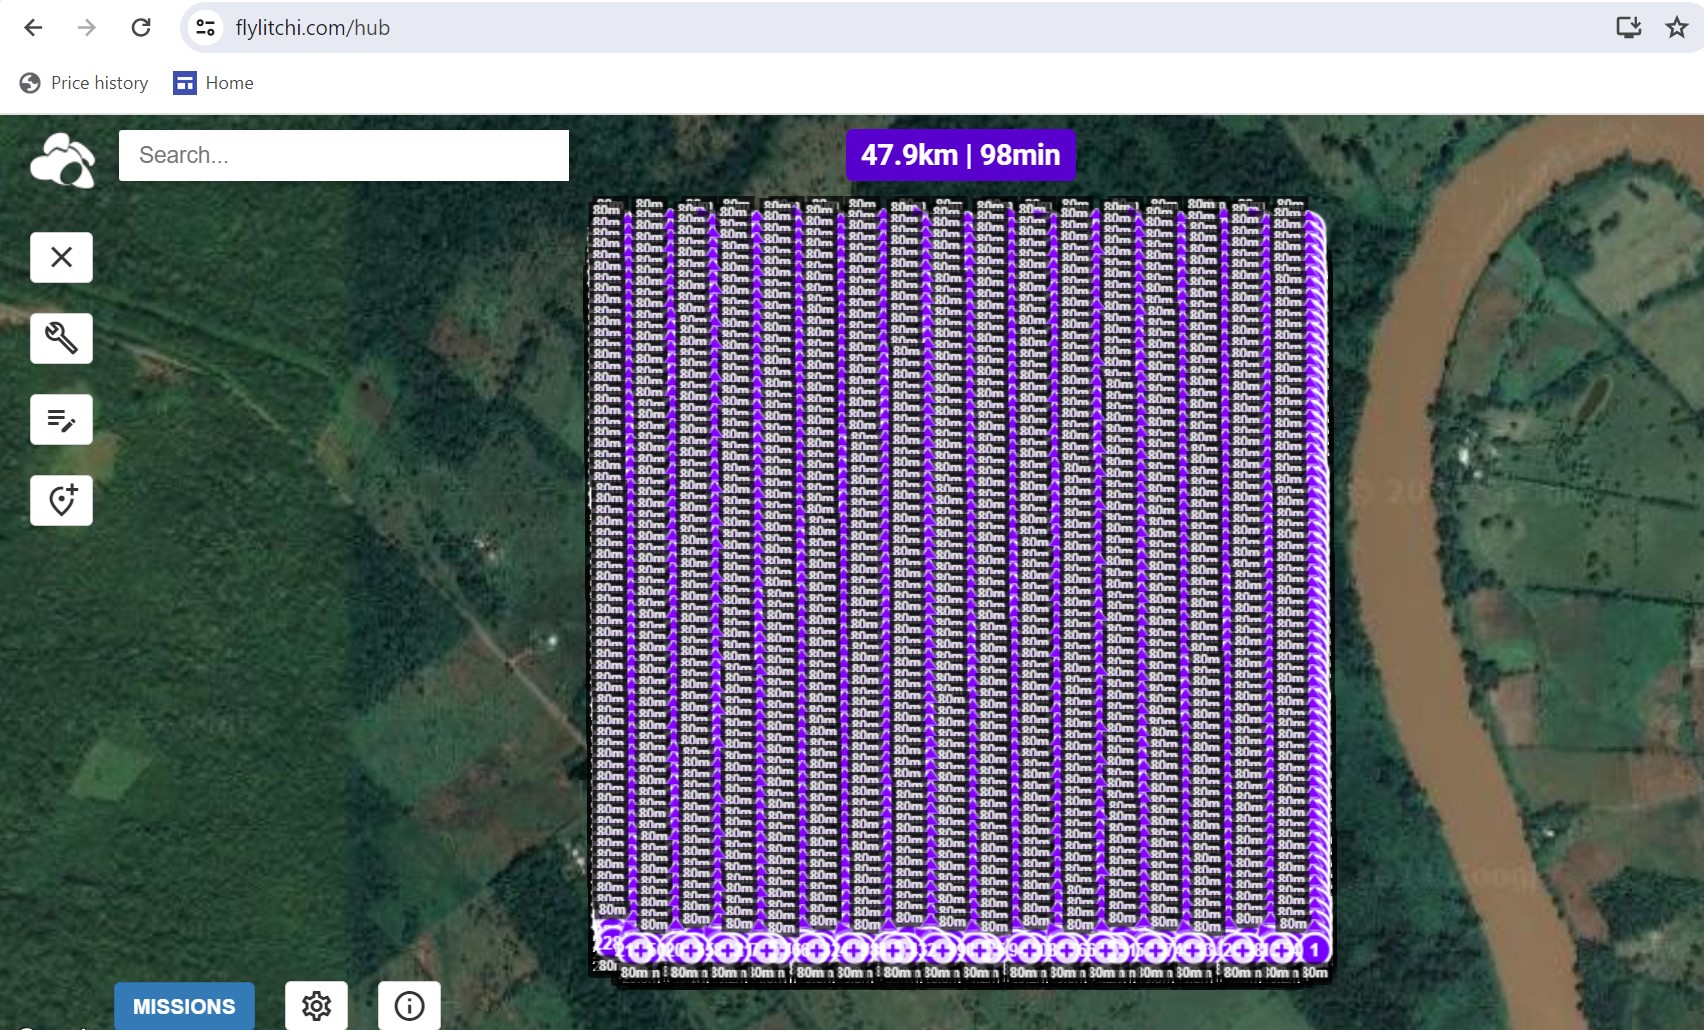
We can now upload the waypoints .csv file into a flight planner like Litchi for further editing.
Drone Mission Planning in Pix4Dcapture Pro#
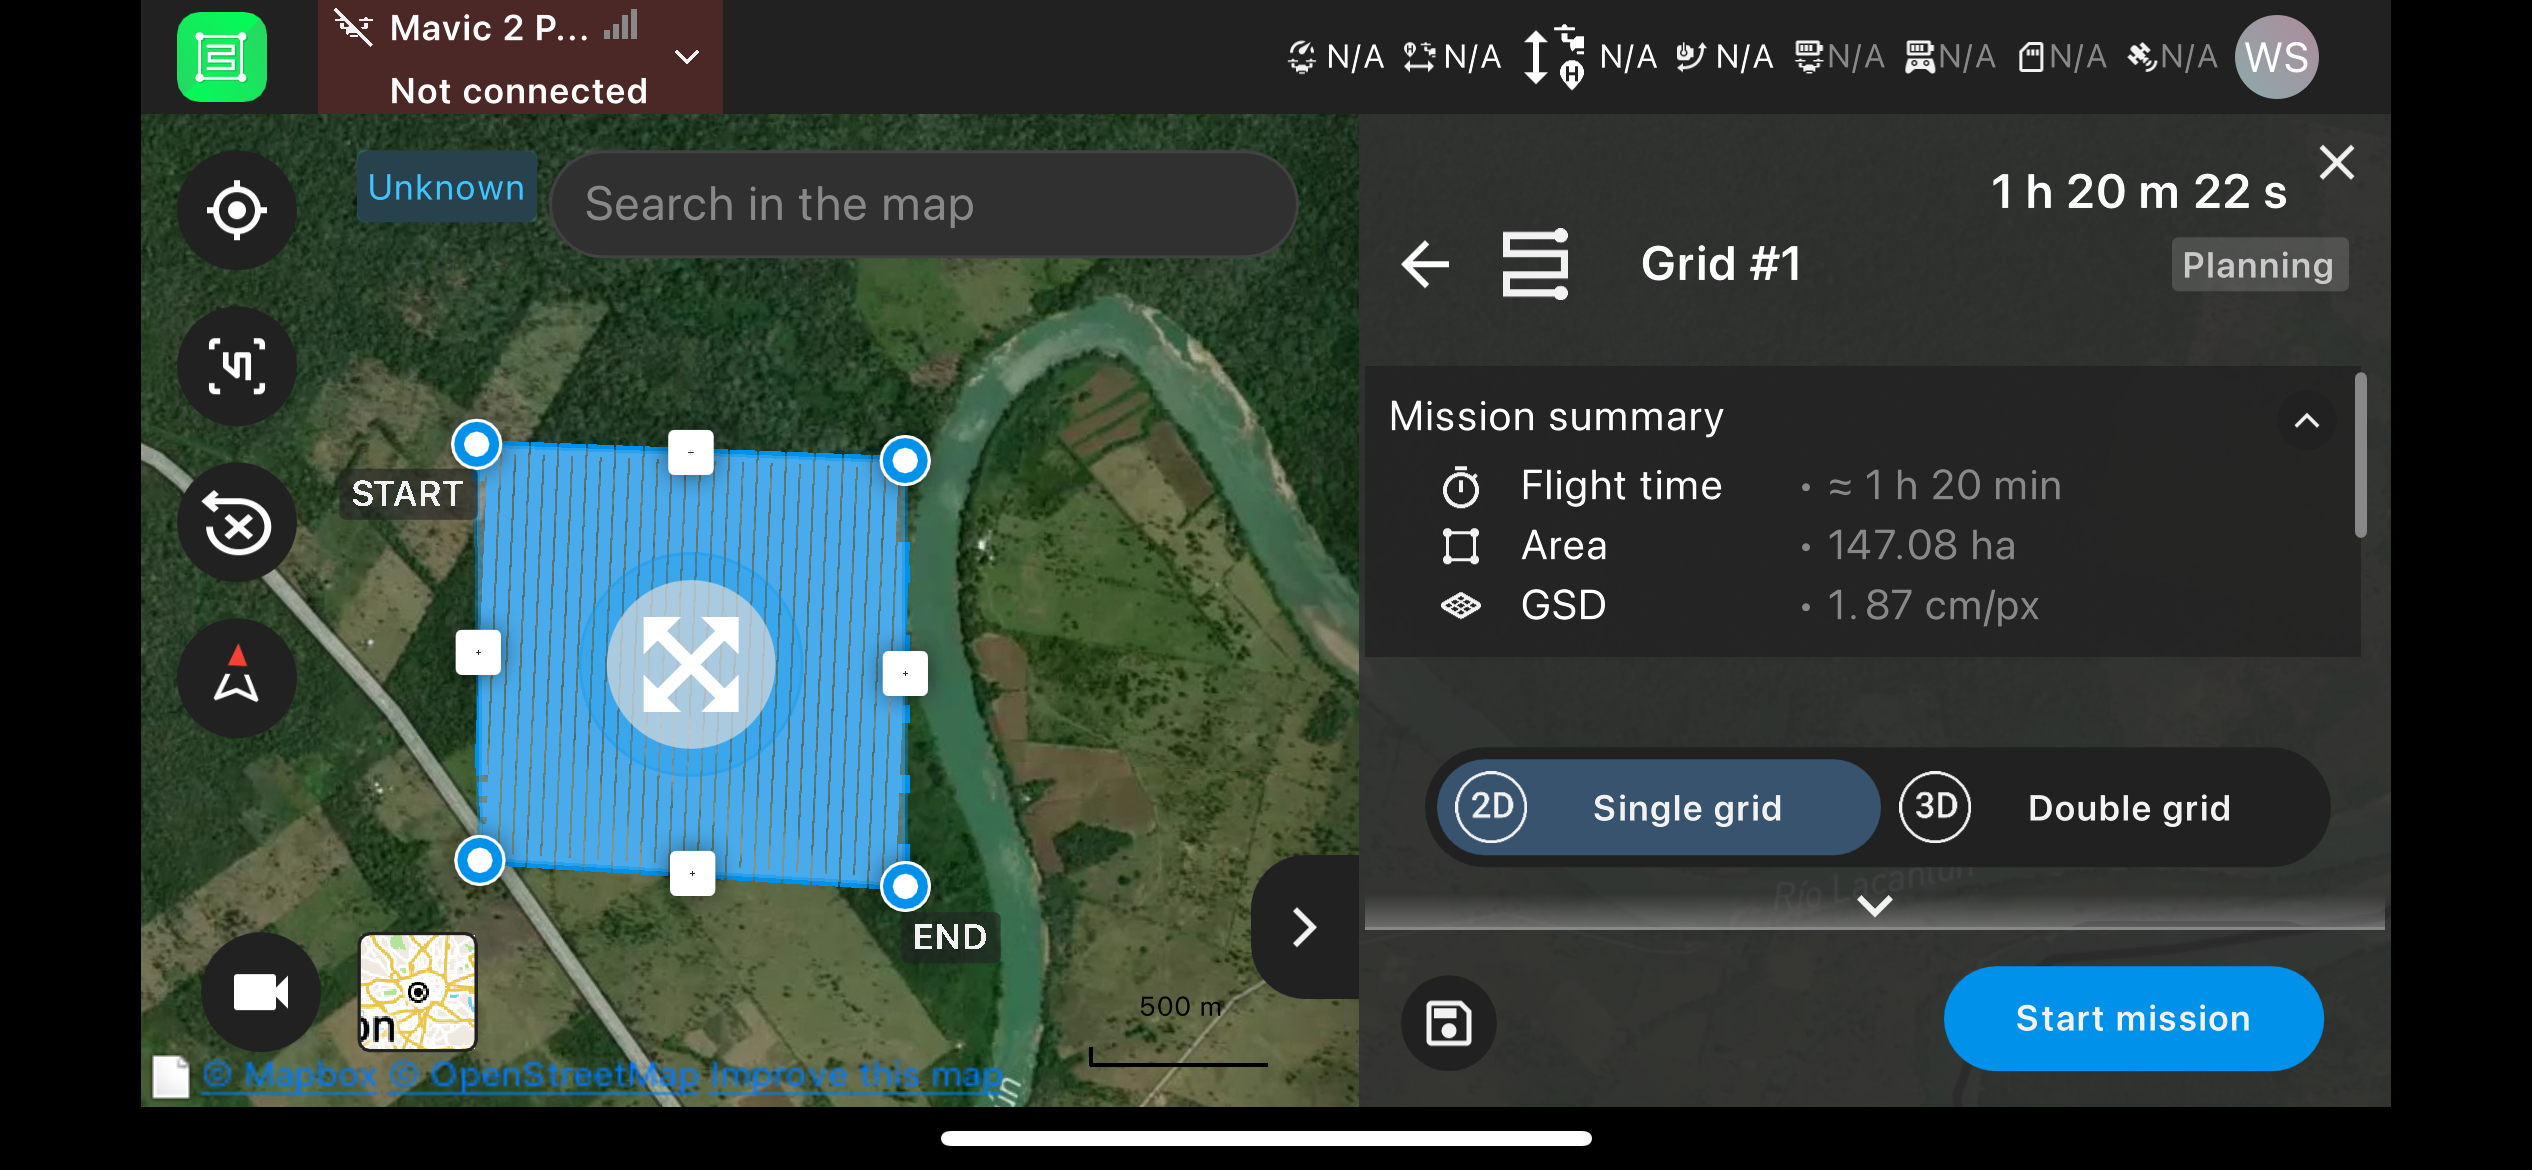
The Pix4Dcapture Pro app is recommended for most drone mission planning. Within the app, users can plan missions that are then uploaded to the drone.
Other Options#
Newer DJI drones are not compatible with most flight planning apps because DJI have not released their software development kit (SDK) to allow an app to communicate with the drone. However, most drones, including DJI, have waypoint features, where waypoints and paths can be programmed into the drone. Flight planning using waypoints through the flight controller can be tedious, but DJI Mapper is a useful tool to automate the generation of waypoints based on flight parameters. The program outputs a waypoint file that can be uploaded to the DJI drone.
WaypointMap is another excellent resource for planning drone flights; however, it is subscription-based for full functionality.
Other Drones#
All recreational drones should have waypoint capabilities. When all else fails, the coordinates generated with the flight planner plugins in QGIS can be exported to a text-based .csv file. This text file can then be manually edited to match the format of the relevant drone. The following is an example of a format used by the Innoflight ScanLift 800 drone:
1 |
0 |
16 |
0.000000 |
0.000000 |
0.000000 |
0.000000 |
-27.5098610 |
153.2224884 |
0.00 |
1 |
0 |
3 |
22 |
0.000000 |
0.000000 |
0.000000 |
0.000000 |
0.0000000 |
0.0000000 |
50.00 |
1 |
0 |
0 |
178 |
1.000000 |
5.000000 |
0.000000 |
0.000000 |
0.0000000 |
0.0000000 |
0.00 |
1 |
0 |
3 |
16 |
0.000000 |
0.000000 |
0.000000 |
0.000000 |
-27.5108490 |
153.2256317 |
50.00 |
1 |
0 |
3 |
206 |
55.439999 |
0.000000 |
0.000000 |
0.000000 |
0.0000000 |
0.0000000 |
0.00 |
1 |
0 |
3 |
16 |
0.000000 |
0.000000 |
0.000000 |
0.000000 |
-27.5145512 |
153.2249908 |
50.00 |
1 |
0 |
3 |
206 |
55.439999 |
0.000000 |
0.000000 |
0.000000 |
0.0000000 |
0.0000000 |
0.00 |
1 |
0 |
3 |
16 |
0.000000 |
0.000000 |
0.000000 |
0.000000 |
-27.5145016 |
153.224873 |
50.00 |
1 |
0 |
3 |
206 |
55.439999 |
0.000000 |
0.000000 |
0.000000 |
0.0000000 |
0.0000000 |
0.00 |
1 |
0 |
3 |
16 |
0.000000 |
0.000000 |
0.000000 |
0.000000 |
-27.5100117 |
153.2252808 |
50.00 |
1 |
0 |
3 |
206 |
55.439999 |
0.000000 |
0.000000 |
0.000000 |
0.0000000 |
0.0000000 |
0.00 |
1 |
0 |
3 |
16 |
0.000000 |
0.000000 |
0.000000 |
0.000000 |
-27.5091724 |
153.2249146 |
50.00 |
1 |
0 |
0 |
20 |
0.000000 |
0.000000 |
0.000000 |
0.000000 |
0.0000000 |
0.0000000 |
0.00 |
1 |
The first row of the chart establishes the home point with coordinates in the eighth and ninth columns. The second row establishes the flight height (50 m) in the tenth column. The third row defines the flight speed (5 m/s) in the fifth column. The fourth row and all other rows with the value of 16 in the third column define the coordinates for waypoints. The fifth row and all other rows with the value of 206 in the third column trigger the camera (only if a camera is integrated into the system). The fourth column after 206 determines the distance (55.439999 m) between photos. The final row sends the drone back to the home point to land.
The following are the commands used in the third column.
CODE |
COMMAND |
|---|---|
22 |
Take Off |
178 |
Mission Speed |
16 |
Waypoint |
20 |
Go to Mission Home Point |
206 |
Camera Shutter |
Note that if the camera is not integrated into the drone, the camera itself can be set to take photos at a set interval before take off (2 seconds, for example).
If using the QGIS Flight Planner plugin, you may need to manually calculate some variables. For example, you might need to calculate distance between photos and speed. You can use the Measure Line tool in QGIS to measure the distance in meters between waypoints. For example, the distance between waypoints might be 15 m. The speed of the drone to take photos every 2 seconds would therefore be equal to 15 m / 2 seconds, or a speed of 7.5 m/s.
To calculate the length of the flight, right-click the flight line in the Contents, open the Field Calculator, type the Output field name (Length, for example), then under Expression, type $length, and change the output field type to Decimal number (real). In the attribute table you should see the value for the length (measured in meters if using UTM). Note that the Measure Line tool can also be used.
Now take that length value, for example 463 m and divide by the speed. At 7.5 m/s, that flight length would take approximately 61.7 seconds, or just over a minute. Note that the drone is not consistently flying 7.5 m/s, as it will need to slow down at times to make turns, but this will give a rough estimate. This time will also not include the time needed for the drone to return to the home point (this value can be added by measuring the distance between the last waypoint and the home point or first waypoint).
All drones will have different formatting for waypoints, but they should all have the capability to upload waypoints in a text file in similar fashion. The specific format will have to be determined by consulting the manual or creating waypoints with a flight controller and exporting them as a text file to view the appropriate format.
Even with all this planning, learning to map with any drone will take some trial and error, based on the drone model as well as the local conditions.
Readings#
Olson, Kyle and Lynne M. Rouse. 2018. A Beginner’s Guide to Mesoscale Survey with Quadrotor-UAV Systems. Advances in Archaeological Practice 6(4):357–371. https://doi.org/10.1017/aap.2018.26
Roosevelt, Christopher H. 2014. Mapping Site-level Microtopography with Real-Time Kinematic Global Navigation Satellite Systems (RTK GNSS) and Unmanned Aerial Vehicle Photogrammetry (UAVP). Open Archaeology 1:29-53. https://doi.org/10.2478/opar-2014-0003
Casana, Jesse, Adam Wiewel, Autumn Cool, Austin Chad Hill, Kevin D. Fisher, and Elise J. Laugier. 2017. Archaeological Aerial Thermography in Theory and Practice. Advances in Archaeological Practice 5(4):310-327. https://doi.org/10.1017/aap.2017.23
Additional References#
Luna, M.A., M.S. Ale Isaac, A.R. Ragab, P. Campoy, P. Flores Peña, M. Molina. 2022. Fast Multi-UAV Path Planning for Optimal Area Coverage in Aerial Sensing Applications. Sensors 22:2297. https://doi.org/10.3390/s22062297