Introduction to the Hydrology Workflow#
In order to conduct several hydrological analyses in ArcGIS Pro, we first have to follow a basic hydrology workflow to generate the appropriate input data for modelling. The general workflow consists of starting with an input digital elevation model and:
Filling pits
Generating a Flow Direction raster
Generating a Flow Accumulation raster
Fill#
Before conducting a hydrological analysis, DEM data must be prepared. DEM data can have several errors related to the interpolation of elevation data, namely pits produced by extreme low points. These pits must be removed; otherwise, a hydrological analysis would direct all streams to these pits. In certain landscapes, these pits may actually be real features. Thus, care must be taken when filling in pits to ensure that real features are not lost in the process.
The Fill tool takes a DEM as input, identifies sinks, and then fills in these sinks using additional interpolation. An optional Z limit can be defined to limit the size of sinks that are filled in. Larger values will fill more sinks, while smaller values will fill fewer sinks. If left blank, all sinks will be filled. Best practice is to run the Fill tool with the Z limit setting left blank, assess the results from later tools, and if necessary, run the Fill tool again with a high Z limit (e.g., 100 m), and iterate through decreasing values.
Another optional step is to smooth the input DEM, using the Focal Statistics tool set to mean. This tool may be iterated several times to produce smoother surfaces as needed. This step is generally needed with higher resolution DEM data.
Flow Direction#
The Flow Direction tool creates a raster representing the direction of flow from each cell to its downslope neighbor. Several methods are available. The most commonly used method is D8, which assigns direction based on a cell’s steepest downslope neighbor (using the 8 surrounding cells). The MFD method is more complex, generating a raster that is visualized the same as a D8 raster but with more complex metadata that is incorporated into later operations. The DINF method assigns the steepest downslope neighbor based on a triangular facet. The Force all edge cells to flow outward option addresses how to deal with edge effects. This option should usually remain unchecked, but if planning to run a basin analysis, this option should be checked. The input raster should be either a DEM or the modified DEM output from the Fill tool.
Flow Accumulation#
The Flow Accumulation tool takes the flow direction raster as an input and creates a raster surface that shows accumulated flow into each cell. The appropriate flow direction type should match the method used to generate the flow direction raster in the previous step.
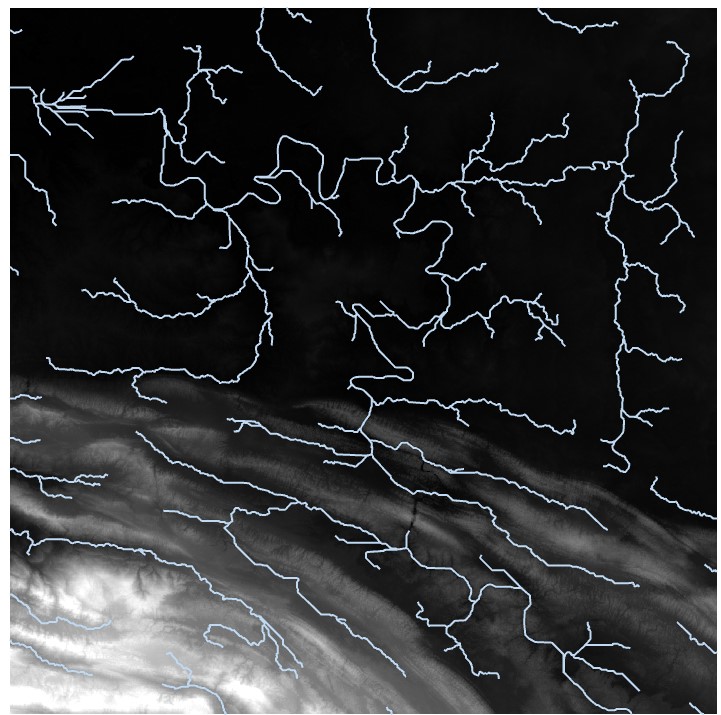
The flow accumulation raster shows a stream network; however, the default visualization may not show enough detail. The symbology can be manually classified into two categories, and a threshold value selected to reveal the desired order of streams; this may take some trial and error. The following image shows the stream network with 5 categories over a geometric interval:
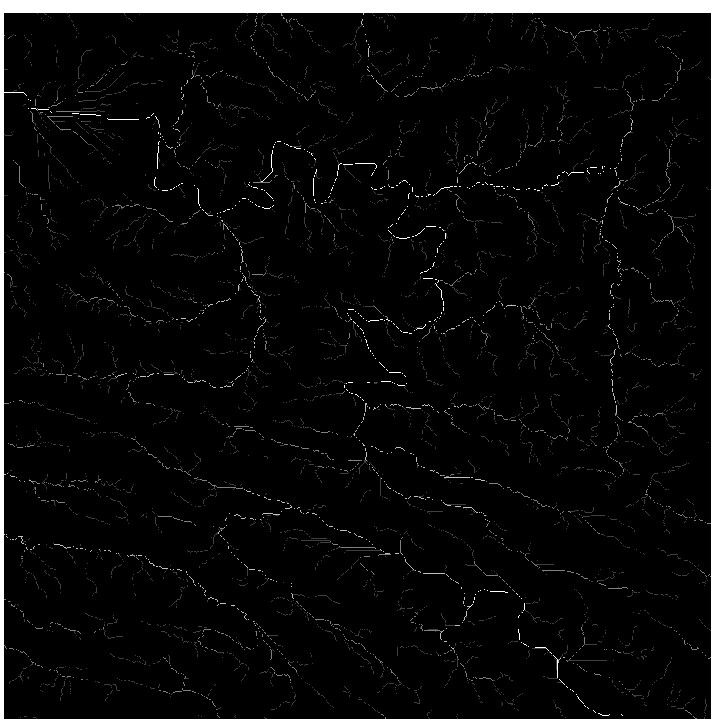
We can reclassify to the following:
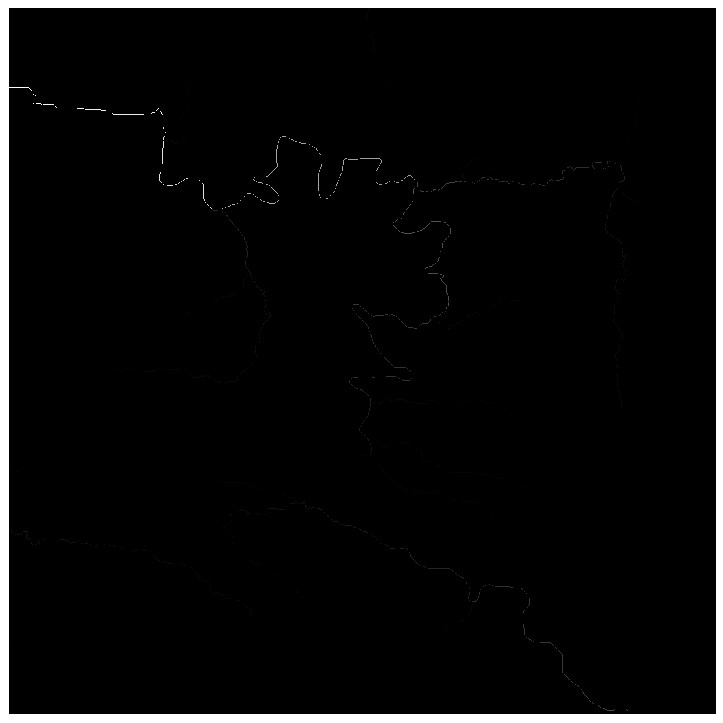
And we can convert to polylines using the Raster to Polyline tool

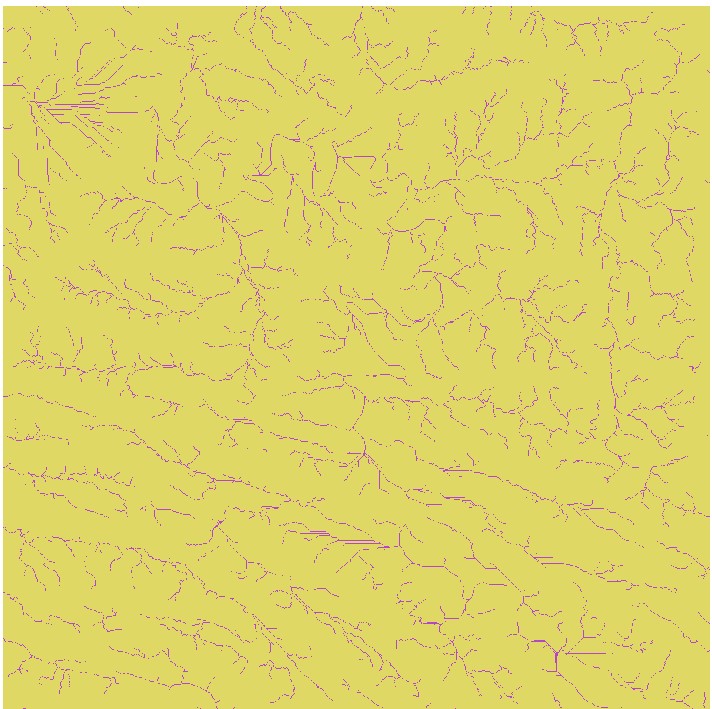
If we want higher order streams, we can change the classification and generate a new polyline feature class: