Zonal Statistics#
Broadly, zonal statistics refer to GIS techniques used to summarize statistics from one raster layer within zones defined by another raster or feature class layer.
Zonal Statistics as Table#
The Zonal Statistics as Table tool will output a table that summarizes a set of statistics (including mean, median, maximum, minimum, etc.) within the zones of a raster layer or feature class.
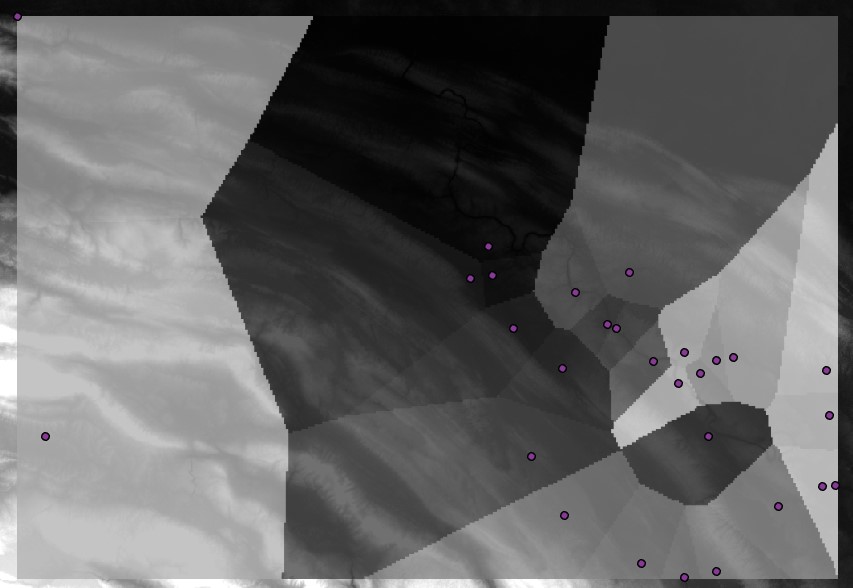
Let’s take the following example of our distance allocation surface generated from archaeological site points. We can summarize several statistics related to another raster layer, in this case the digital elevation model. The following image shows the distance allocation surface displayed over the DEM with a 30% transparency:
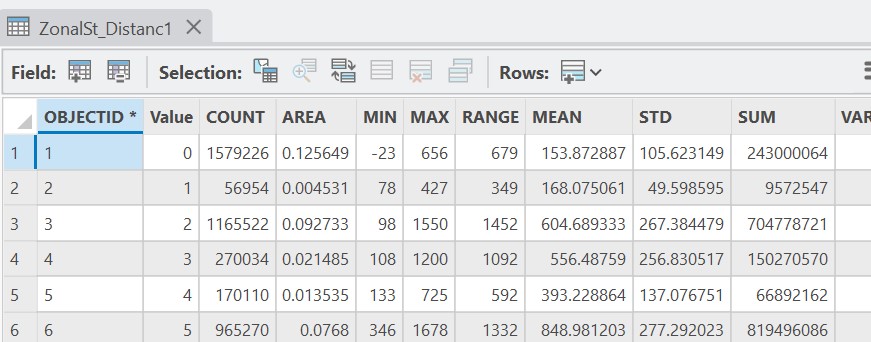
After running the Zonal Statistics as Table tool, we generate the following table showing various statistics within each zone defined by the distance allocation raster:
Zonal Statistics#
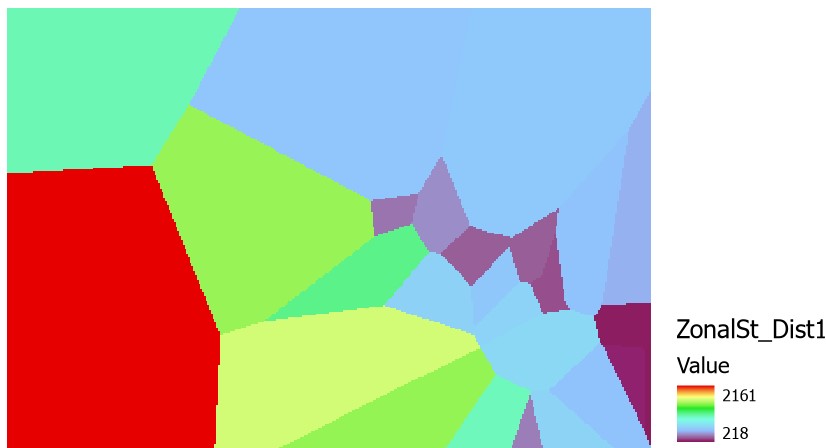
The Zonal Statistics tool performs a similar operation as the Zonal Statistics as Table tool, however, the output is a raster layer with cells assigned to a given statistic within zones. The following raster layer shows the maximum elevation recorded from the input DEM, summarized within each zone generated from the distance allocation of input point data (archaeological sites):
Zonal Geometry as Table#
The Zonal Geometry as Table tool summarizes in tabular form several geometry statistics based on a raster of zones (each represented by a single value). In contrast to the Zonal Statistics tools, the Zonal Geometry tools require only a single layer. This single layer must represent zones of interest. In contrast, no additional raster is needed to summarize statistics because all of the geometry statistics are inherent to the input zonal raster.
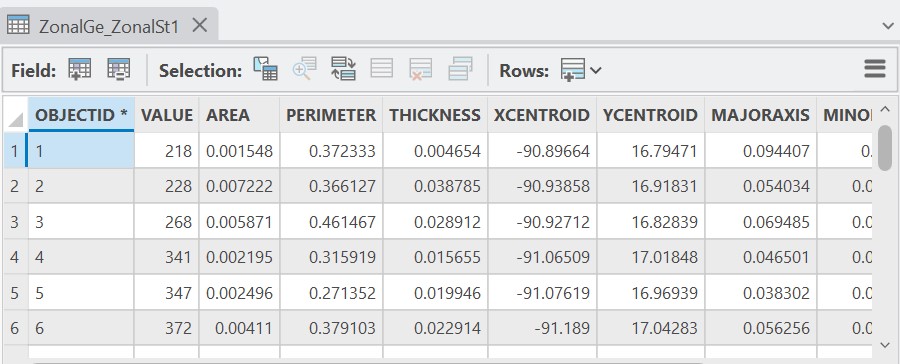
The following table summarizes several geometry statistics from the distance allocation grid:
Zonal Geometry#
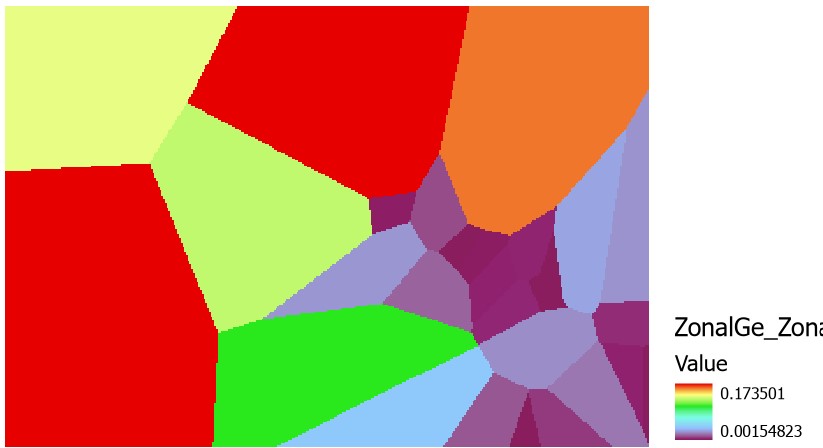
The Zonal Geometry tool, like the Zonal Statistics tool, summarizes values in raster form, namely values based on a geometry calculation defined in the tool parameters.
The following output raster displays each zone generated from the distance allocation tool with its area value (calculated from the units of the coordinate system):
Region Group#
The Region Group tool will take a raster layer as input that has several separated cell zones with the same value. The output of the Region Group tool will be a new raster where each zone has been assigned its own unique value.
When the following raster layer is input, where each zone has the same value (in this case 0 over NoData):
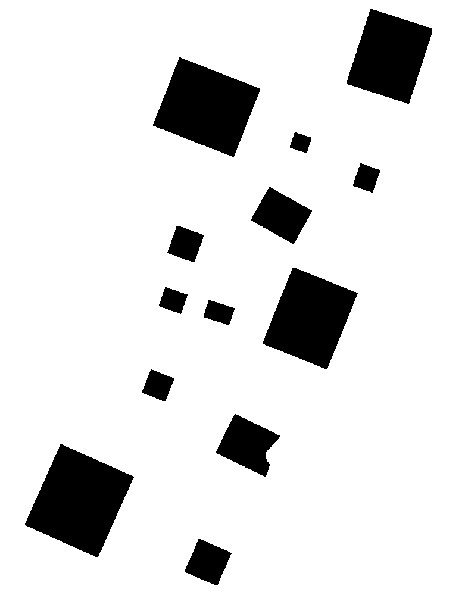
The following output raster is returned, where each zone has been separated into its own value: