Viewshed (Planar)#
In GIS, viewshed analysis generally produces a raster where cells are assigned values that are either visible or not visible from one or more points defined by an input feature class (point or polyline) and a digital elevation model. ArcGIS Pro has two primary methods for conducting a viewshed analysis, each based on whether the input DEM is in planar or geographic coordinates. The tools discussed here should be used on data assigned a planar coordinate system.
Viewshed (Spatial Analyst)#
The Viewshed tool is available in the Spatial Analyst toolbox. This tool takes as input a digital elevation model in a planar coordinate system and a set of points or polyline representing observer features or lookout points. The optional “Use earth curvature corrections” box is unchecked by default but should always be checked to compensate for the Earth’s curvature.
The following image shows areas visible from a single site:
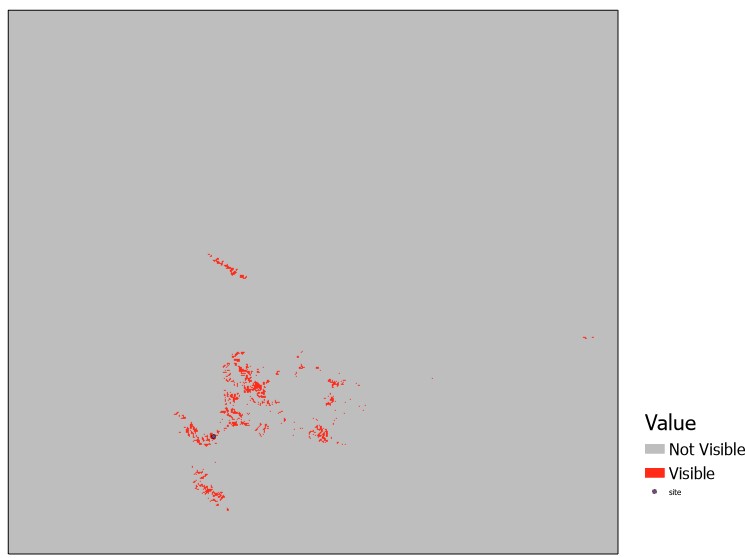
Note that if not automatically visualized in this manner, the symbology can be edited to show Unique Values (in this case 0 and 1).
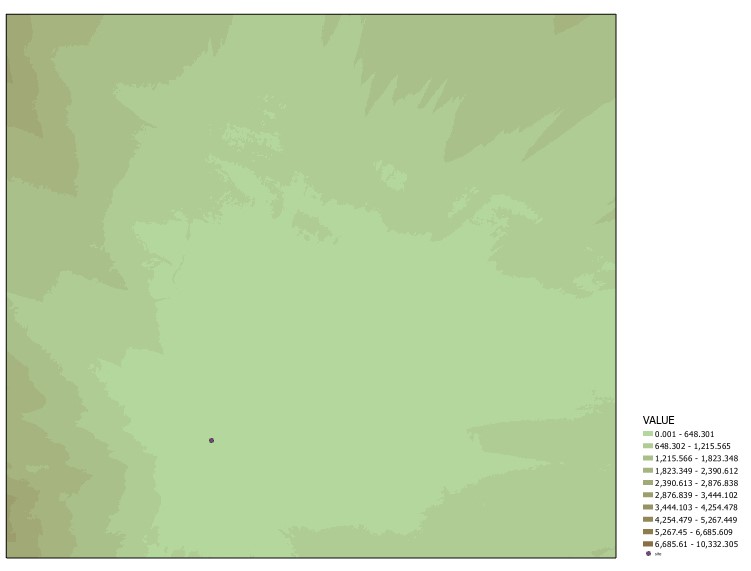
The above ground level raster will show the heights (measured in the units of the coordinate system) needed to be added to each cell to become visible from the input points:
When multiple points are input to the Viewshed tool, the resulting raster assigns values to each cell representing the number of observer points that can view that cell:

Note that if not automatically visualized in this manner, the symbology can be edited to show Unique Values (in this case integers from 0 to 5).
We can also add an offset to either the input points or the input DEM. For example, we might want to visualize the viewshed from an individual’s eye level or from the top of a building. We also might want to add an offset to cells in the DEM representing architecture, trees, etc. that might be visible when elevated. Offset values should be added as new fields to the input point or polyline observer features.
If the field is named OFFSETA, the cell value will increase the elevation of the observer point by that amount. In other words, a value of 1.5 (measured in the units of the coordinate system) might represent the height of a human observer, or a value of 10 might represent a viewing platform on a building. Adding this offset will increase the viewshed area. Alternatively, a field named SPOT could be added with the value representing the absolute elevation of the observer point rather than its elevation above the DEM.
If we instead add the value 10 to the OFFSETB column, we are adding that offset to all cells other than the observer point. We are therefore elevating the surrounding terrain while keeping the observer point the same. The resulting output raster will show areas where a 10 m high feature would be visible from the observer point:

If the range of the viewing field needs to be restricted, for example, based on specific compass directions, additional fields can be added to the observer point attribute table, namely AZIMUTH1 and AZIMUTH2. Values between 0 and 360 will restrict the output raster visibility surface to those compass directions relative to the observer point.
Field names VERT1 and VERT2 will define the vertical angles relative to the observer point. The default values are -90 to 90, representing a full vertical range of vision.
RADIUS2 will limit the outer distance of the output viewshed raster, and RADIUS1 will limit the inner distance, or a minimum line-of-sight distance, measured in the units of the coordinate system.
Observer Points#
The Observer Points tool is similar to the Viewshed tool, however the output has additional information about which cells are visible from multiple input points. The Observer Points tool has the same inputs, but the output raster differs in its metadata. We can best interpret the output by looking at the attribute table of the output raster:
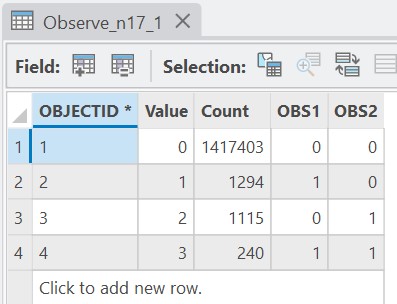
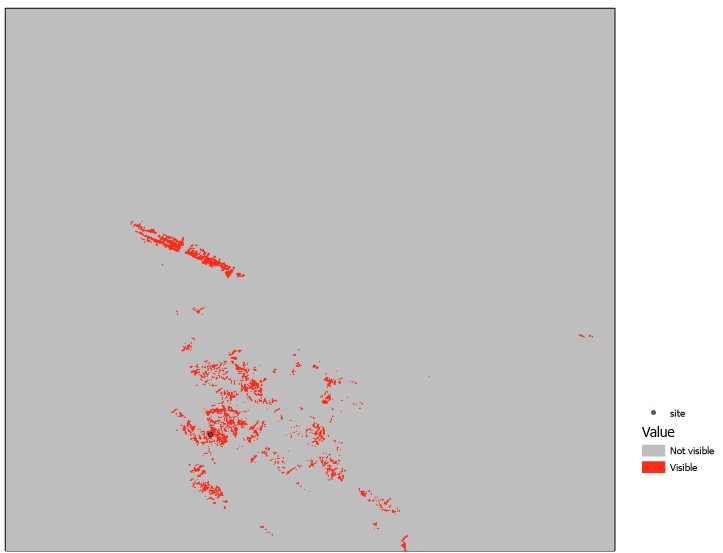
This table shows that the output raster has 4 values ranging from 0 to 3. The value 0 represents cells that are not visible from any of the observer points. The value 1 represents cells that are visible from one of the observer points. The OBS1 and OBS2 fields indicate which observer point has visibility, in this case OBS1. The value 2 represents cells that are visible from one of the observer points, in this case OBS2. The value 3 represents cells that are visible from both observer points. The output raster is shown below, with the symbology and labels updated accordingly:

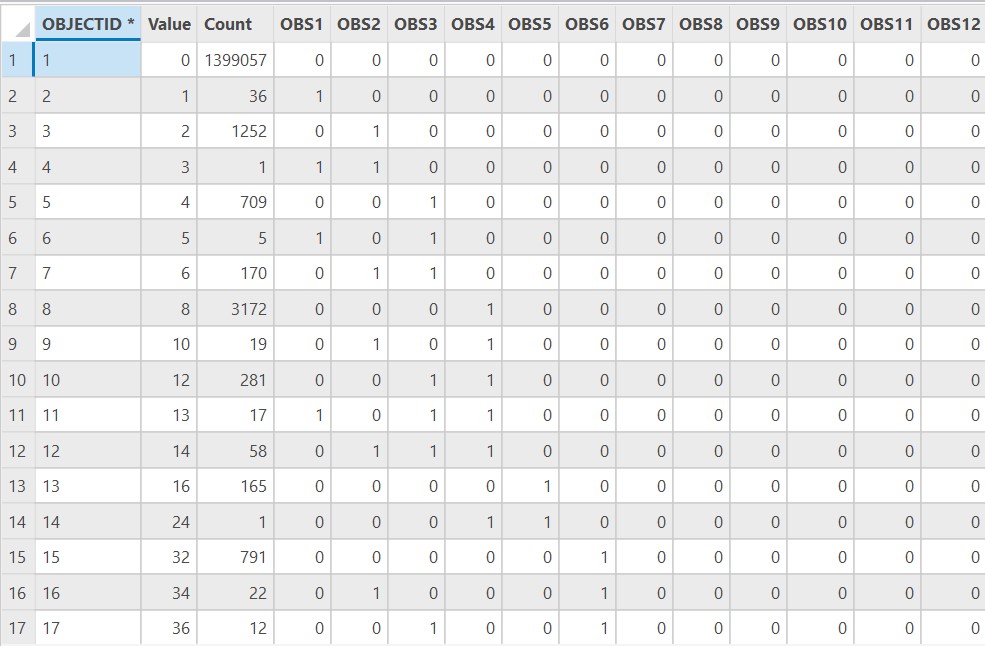
A maximum of 16 observer points can be input into the Observer Points tool; however, the tool is best used with fewer points, as the output can get too burdensome. Take a look at the output raster’s attribute table, for example, when 12 points are input. These data could be difficult to decipher and visualize properly:
Visibility#
The Visibility tool combines the Viewshed and Observer Points tool into a single tool. When the Analysis type is set to Frequency, the output raster is in the format of the Viewshed tool’s output raster. When the Analysis type is set to Observers, the output raster is in the format of the Observer Points tool’s output raster.