Additional Hydrology Tools#
Once the basic hydrology workflow has been followed, we can conduct several other hydrological analyses with the outputs from previous tools.
Stream Order#
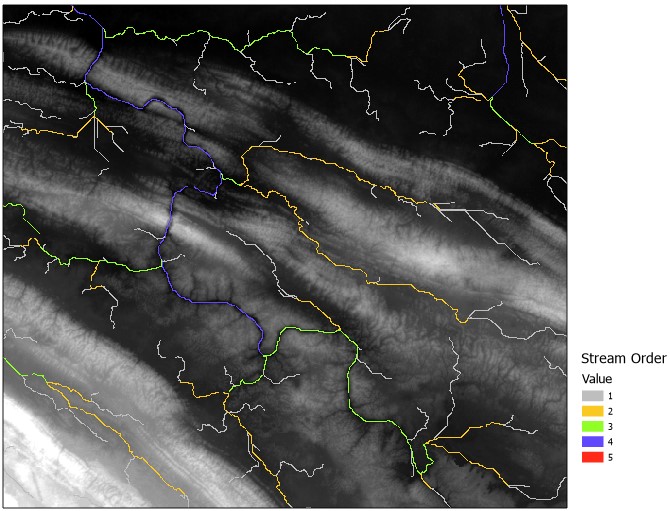
The Stream Order tool will take a raster input of a stream network and generate a new raster showing stream order. Stream order refers to a hierarchical network of streams, with higher order streams representing major waterways and first-order streams representing the smallest tributaries.
The Input stream raster can be the flow accumulation raster, or a modified flow accumulation raster of streams above a defined threshold. Values below this threshold can be set to NoData using a SetNull operation in Raster Calculator:
SetNull("flow_accumulation.tif" < 3500, "flow_accumulation.tif")
In this operation, the flow accumulation raster values below 3500 are set to NoData, otherwise values above 3500 keep the same values in the flow accumulation raster. The resulting raster surface shows streams classified based on stream order:
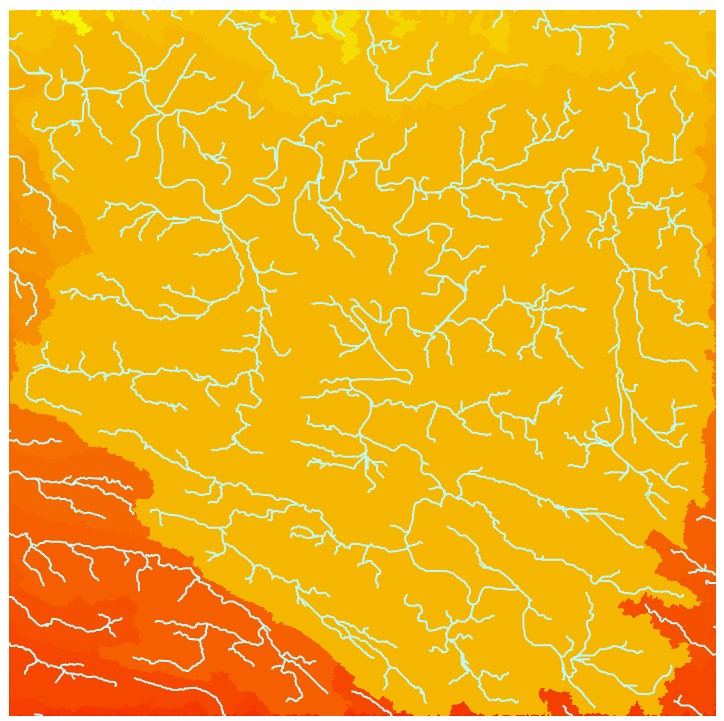
Basin#
The Basin tool creates a raster delineating drainage basins. The basins are defined by the presence of ridge lines. The input is a D8 flow direction raster.
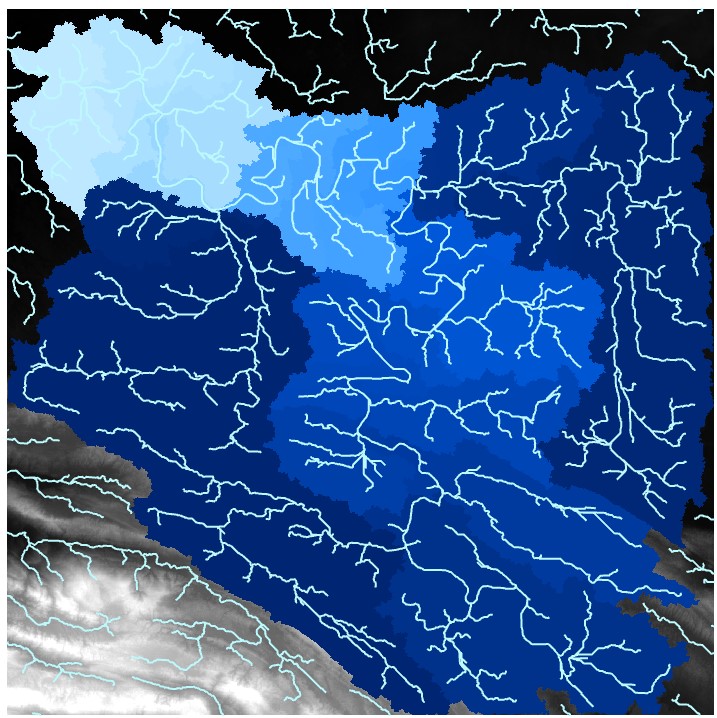
Watershed#
The Watershed tool determines the contributing area above a set of cells, known as pour points, in a stream network. Compared to the Basin tool, the Watershed tool offers more user input to define watersheds. To run a watershed analysis, a D8 flow direction raster is needed, and a set of pour points that will define the watersheds above them. The pour points can be defined by an input point feature class, or a flow accumulation raster (or a modified flow accumulation raster above a defined threshold – the higher the threshold, the larger the resulting watershed areas) can be input to automatically determine pour points. If pour points are to be identified manually, Snap Pour Point tool should be run on this feature class first. This tool generates a raster surface of pour points snapped to the appropriate grid cells.
The output watershed can be visualized by changing the symbology to a graduated theme: