Quality Control#
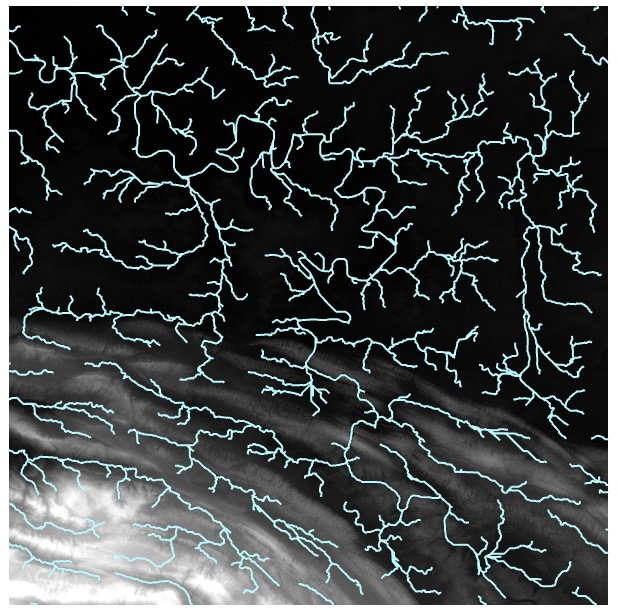
The results of a hydrology analysis in ArcGIS Pro might appear accurate at first glance, but visual assessment is need to ensure a correct stream network has been identified.
In the previous flow accumulation analysis, for example, we can see a major error in the stream network, inside the yellow circle:
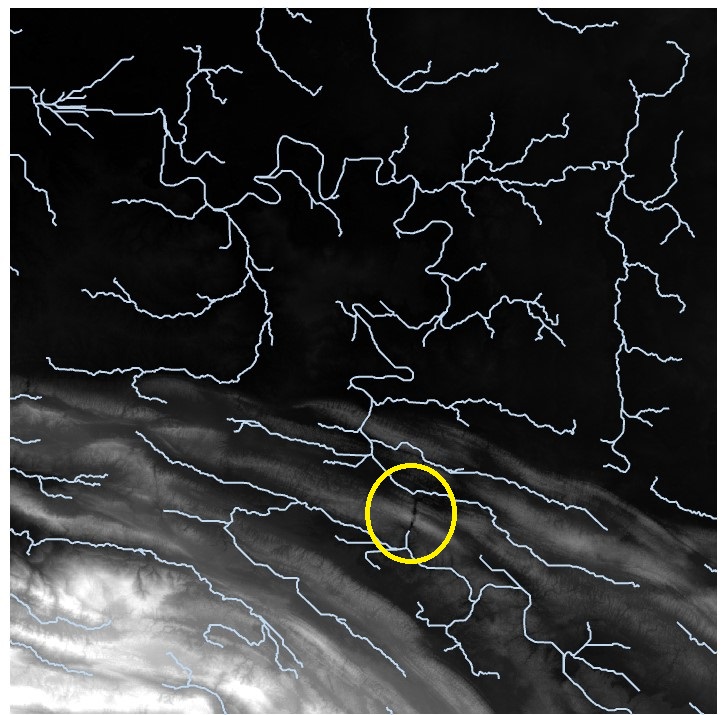
Here, the high order stream (major river) enters a narrow canyon. During the interpolation of the SRTM DEM to fill voids, high elevation values for the canyon walls replaced the actual elevation values at the river surface.
If we have access to a more accurate elevation surface, we could replace these values with the more accurate elevation values, using Cell Statistics or Raster Calculator. Alternatively, if no other data are available, we might have to manually adjust the cell values in these areas.
Breaklines#
One option is to adopt an approach using breaklines, which are boundary lines used in the generation of DEM data to restrict certain interpolation values, for example, along a river bank. We can therefore manually assign appropriate values along the river to correct the flow accumulation analysis.
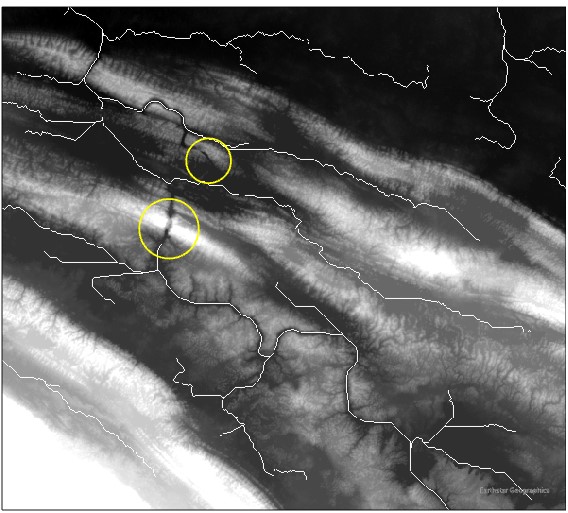
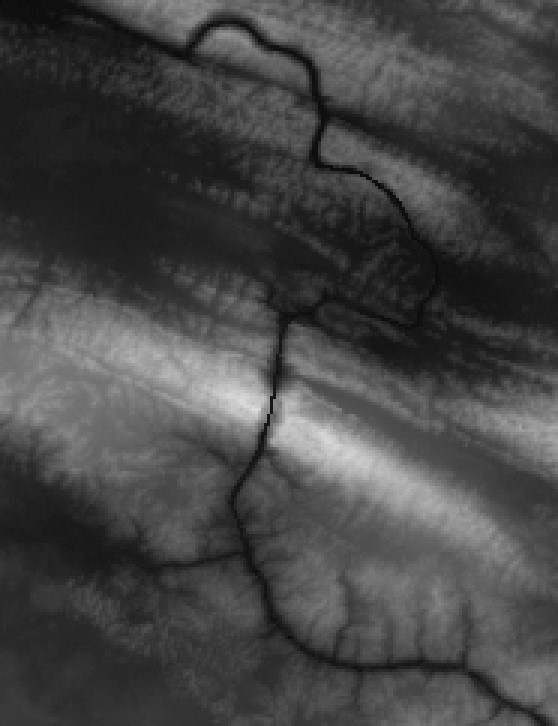
In the following zoomed in portion of the stream network, we can see that two areas caused issues inside the yellow circles:
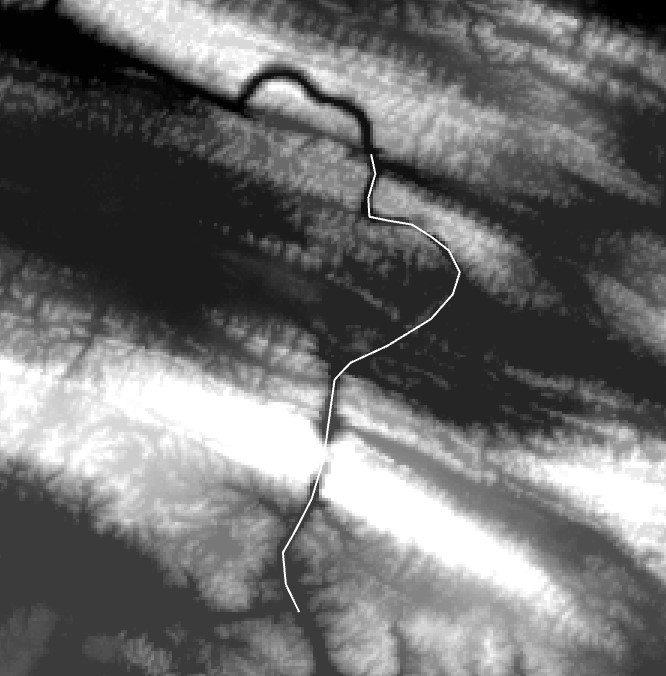
We could just draw a line connecting this portion of the stream network; however, any other analyses we run will produce undesirable results (e.g. stream order, basin, watershed). We therefore need to alter the flow direction raster.
We begin by creating a new polyline feature class and drawing the section of river as a breakline. We need to ensure that the line starts well before and ends well after the errors in the DEM occur.
We can now run the Generate Points Along Lines tool to create sample points. After selecting Point Placement By Distance, we want to define a distance that is the same or lower than the cell size of the DEM, and include end points.
We then run the Extract Values to Points tool to add a field in the point attribute table that includes the elevation taken from the DEM. The input point features are the points generating along the polyline, and the input raster is the DEM we want to modify.
The points should automatically be in descending order by the RASTERVALU field. Review the values: they should clearly descend from a maximum to a minimum. If any values between are higher than they should be, manually edit them so that all values descend from maximum to minimum.
Now run the Point to Raster tool on the point feature class with the corrected elevation values, with the cell size and snapping set to the original, unmodified DEM. Use Cell Statistics set to minimum to combine the original, unmodified DEM with the interpolated values along the river (ensure that under Environments, the cell size, snapping, and processing extent are all set to the unmodified DEM input). The output will be a modified DEM with the river burned into the canyon (note that running Focal Statistics set to minimum before running Cell Statistics will widen the river if necessary):
Running the hydrology workflow on the resulting burned DEM should lead to improved results: