Lab 3: Joins, Relates, and Summarizing Data#
In this lab, students will work on a large dataset of archaeological features in southeastern Mexico to summarize relevant statistics. These features were annotated over digital elevation models generated from lidar data. We will not be working with these digital elevation models yet (we will revisit these data when exploring raster datasets later in the semester). Instead, we will be working with the annotated vector files related to these lidar data. The lidar data were collected with NASA’s G-LiHT system in a single transect, which is further subdivided into smaller tiles that we will use as our analytical extent. This lab will illustrate some of the most important concepts in working with spatial vector data: joins and relates.
The data for this week’s lab includes:
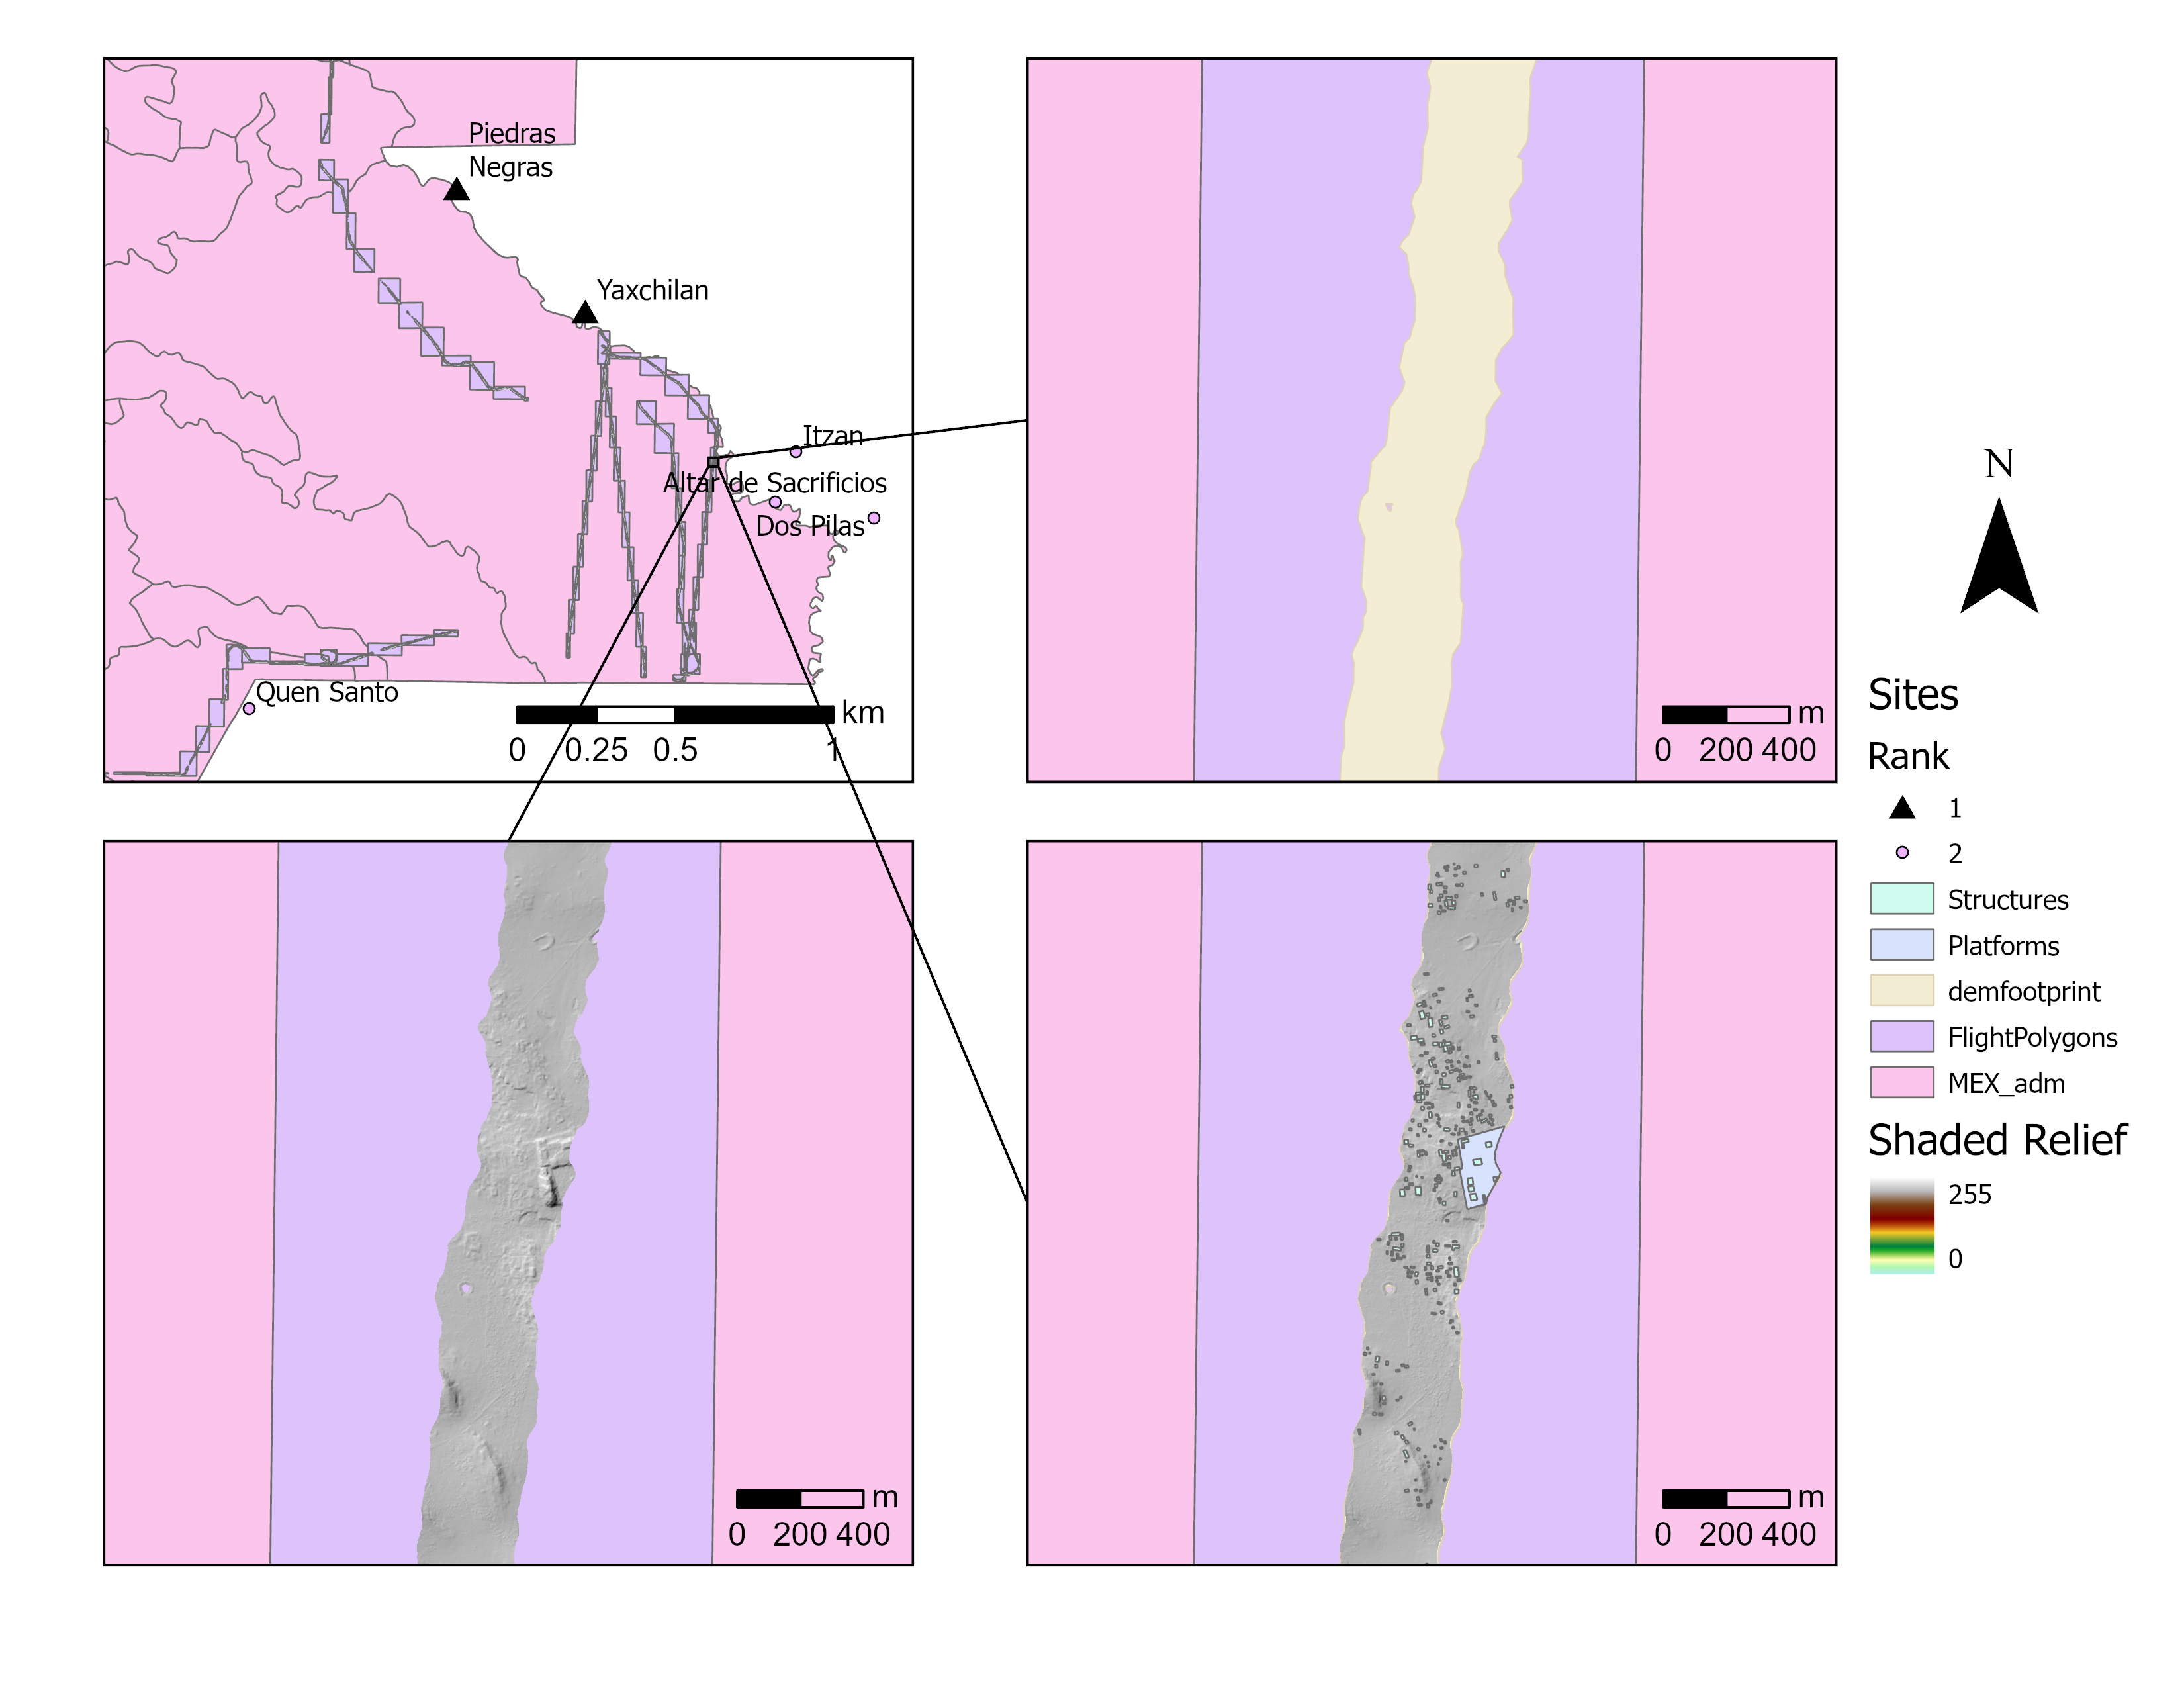
FlightPolygons.shp – a feature class representing the bounding extents of the 458 digital elevation model tiles that were generated from lidar data.
demfootprint.shp – a feature class representing the full footprint of the digital elevation model tiles in southeastern Mexico. This file is a single record equivalent to the exact area of the survey transect.
centroids.dbf – a table with the spatial coordinates of the center of each flight polygon, with a unique id number for each record.
Sites.shp – a feature class of archaeological sites. For this study we used the Witschey and Brown 2010 database of known Maya sites. These sites were classified into three types: Type 1 representing the largest Maya sites, Type 2 representing smaller sites, and Type 3 representing the smallest sites. The Sites.shp only has data for Type 1 and Type 2 sites. We do not have access to the data for Type 3 sites.
numberofsites.csv – a table with the same unique id numbers from centroids.dbf and the number of sites within 10 km (this value includes Type 1, Type 2, and Type 3 sites).
soiltypes.csv – a table with the same unique id numbers from centroids.dbf and numberofsites.csv and the predominant soil type within the tile.
MEX_adm.shp – a feature class of Mexican municipios, essentially equivalent to what we call counties in the U.S.
Structures.shp – a feature class of annotated archaeological structures. These records represent architecture constructed above a platform or the ground surface.
Platforms.shp – a feature class of annotated archaeological platforms. These records represent architecture that supports a structure.
The following maps illustrate what the various feature classes represent:
For this lab, you will need to use all of these data to produce four maps. These maps can be combined on to a single layout, or you can submit four separate layouts.
The first map should display the Mexican states within the spatial extent of the tiles of flight polygons. The states should be assigned a continuous color scheme that represents the number of tiles or flight polygons inside that state.
The second map should show the state of Chiapas with the tiles or flight polygons in Chiapas, displayed with a continuous color scheme representing the density (count divided by DEM footprint area) of structures and platforms that have a footprint area greater than or equal to 20 square meters. Include labelled Type 1 and Type 2 archaeological sites. At this scale, the FlightPolygons.shp feature class should be used for this display rather than the demfootprint.shp, which will likely not be visible at smaller scales.
The third map should show the state of Chiapas with the tiles or flight polygons in Chiapas, displayed with a continuous color scheme representing the number of Type 1, Type 2, and Type 3 sites within 10 km of each tile. Include labelled Type 1 archaeological sites with a 10 km buffer, and labelled Type 2 archaeological sites without a buffer. At this scale, the FlightPolygons.shp feature class should be used for this display rather than the demfootprint.shp, which will likely not be visible at smaller scales.
The fourth map should show the state of Chiapas with the tiles or flight polygons in Chiapas, displayed with a discrete/categorical color scheme representing the predominant soil type in each tile. Include labelled Type 1 and Type 2 archaeological sites. At this scale, the FlightPolygons.shp feature class should be used for this display rather than the demfootprint.shp, which will likely not be visible at smaller scales.