Tables#
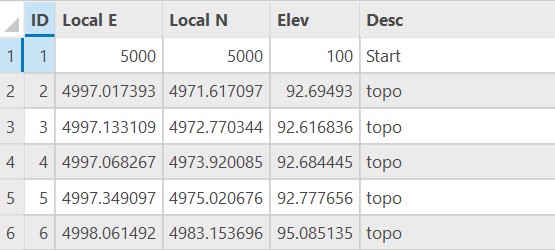
The table is the fundamental type of data used in GIS, as both vector and raster data can be visualized in tabular form. A table is the on-screen rendition of a tabular set of data, also known as a spreadsheet. It is an array of recorded facts that are arranged in horizontal rows called “records” and vertical columns called “fields.”
Tables can include values of several types:
-numbers, which can represent integers (i.e., whole numbers such as -3, -2, -1, 0, 1, 2, 3) or as floating-point numbers (i.e., decimal numbers such as 1.58)
-strings, which represent text characters (note that numbers can also be included in strings, for example the address 330 Newell Dr)
-Booleans, representing true or false
-Date, four digit year followed by two digit month and two digit day
Adding Tables to ArcGIS Pro#
ArcGIS Pro accepts several types of tables, including dbf and csv (Excel spreadsheets, .xls or .xlsx are not readable).
When a table is independent of spatial data, it is called a freestanding table or standalone table. These can be imported into ArcGIS Pro like any other data but when added, a new section in the Contents is added under Standalone Tables. These tables cannot be displayed in a map frame as there is no spatial connection. Instead, by right-clicking the table under Contents and selecting Open, you can view the table in a new pane.
The second type of table in GIS is an attribute table, which represents tabular data that has a spatial or cartographic layer. The attribute table adds attributes to each spatial record in the layer. Attribute tables are usually associated with vector data, but rasters also have attribute data that can sometimes be displayed in tabular form. Attribute tables are automatically imported into ArcGIS Pro when a layer is added with Add Data. The attribute table of any layer can be viewed by right-clicking the layer in Contents and selecting Open Attribute Table.
Adding a Spatial Reference to Standalone Tables#
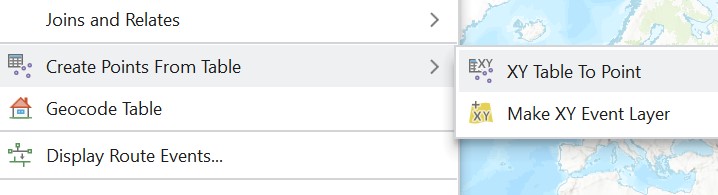
To visualize standalone tables in a map frame in GIS, the table must have at least two columns of data that represent the X and Y coordinates (other optional coordinates include Z and M). If the standalone table has these data, add the table to ArcGIS Pro, then right-click the table in Contents and select Create Points From Table -> XY Table To Point. This tool is also available in the Geoprocessing pane.
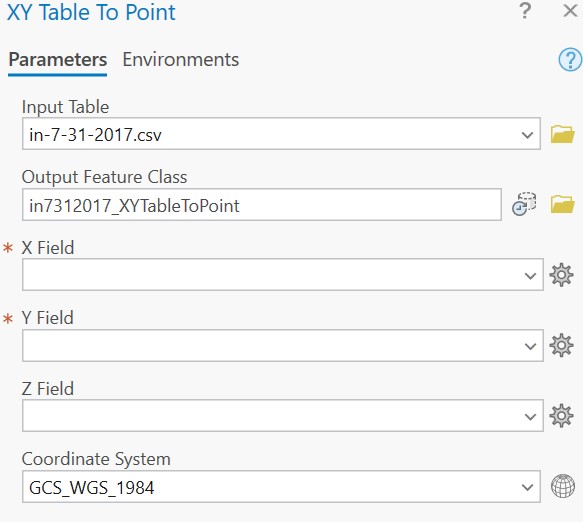
The XY Table To Point tool takes a standalone table as input, to create a feature class output, with parameters including setting which columns will represent the X and Y data (and optionally the Z if elevation is known). Finally, and critically, the coordinate system must be selected (in this case, the user must know the correct coordinate system).
Exporting Tables#
Attribute tables can be viewed in ArcGIS Pro, but they can also be exported and viewed as a standalone table. Unlike the standalone table above, attribute tables have the spatial reference connected as metadata. We might want to add the coordinates to an attribute table before exporting it as a standalone table. To do so, use the Add XY Coordinates tool in the Geoprocessing pane.
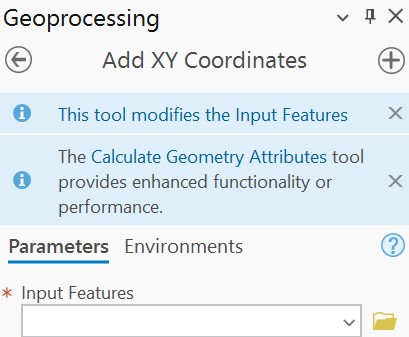
This tool takes a feature class as an input, seemingly with no parameters. However, you must also specify the Output Coordinate System under Environments. Once the tool is run, two new columns will be added to the attribute table, POINT_X and POINT_Y.

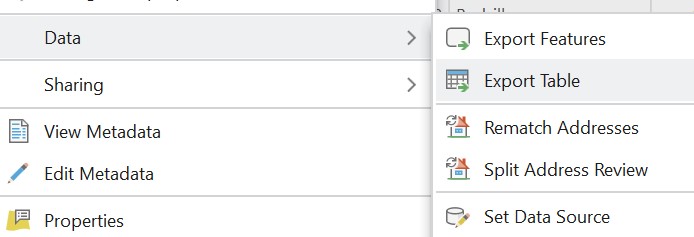
The attribute table can then be exported by right-clicking on the layer under Contents, selecting Data -> Export Table. Select an output location and file type, and click OK.
Adding Fields and Records to Tables in ArcGIS Pro#
To add additional fields (columns) to your tabular data (either attribute tables or standalone tables), open the table in ArcGIS Pro from the layer properties in Contents. Click the Add Field button.
Here, you are prompted to assign a Field Name to your column, a Data Type, a Number Format, Precision, Scale, and/or Length.
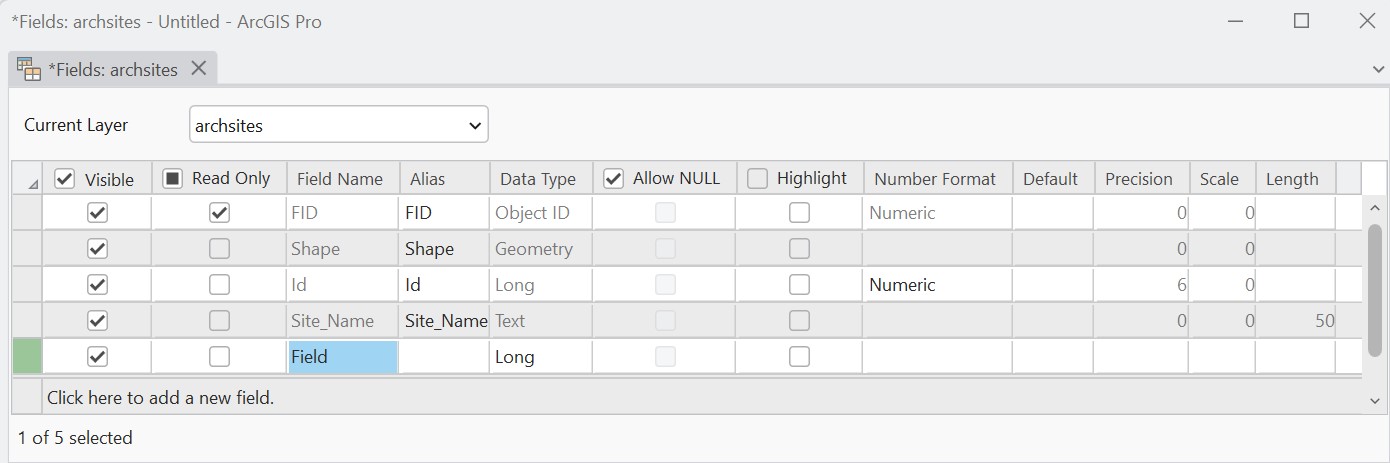
Field Name refers to the name or description of the column. Data Type can be Short (integer), Long (integer), Float (short decimal), Double (decimal), Text, or Date. Short integers are 16-bit, long integers are 32-bit, float values are 32-bit decimals, and double values are 64-bit decimals. Number format should generally be set to Numeric. Precision refers to the total number of digits in numeric values, including any numbers to the right of a decimal point. Both integers and float values have precision. However, only float values have scale, which refers to the number of digits to the right of the decimal point. For example, the integer 1,000,001 has a precision of 7 and no scale. The float value 1.000001 also has a precision of 7 but a scale of 6. Length is only relevant for Text fields and refers to the length of the string, in other words the number of characters including spaces.
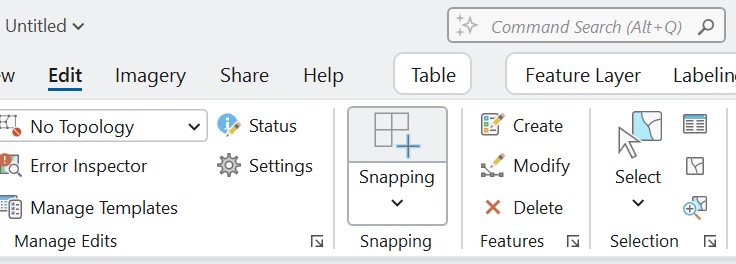
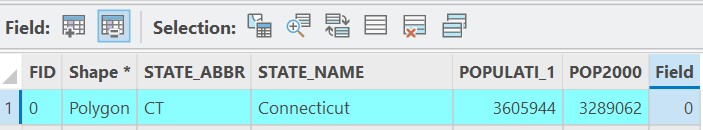
Once the field data types have been defined, click the Save button under Fields -> Manage Edits. This save button is not to be confused with the save buttons for the project or for the editing tools. You will now see a new but empty column in the table.
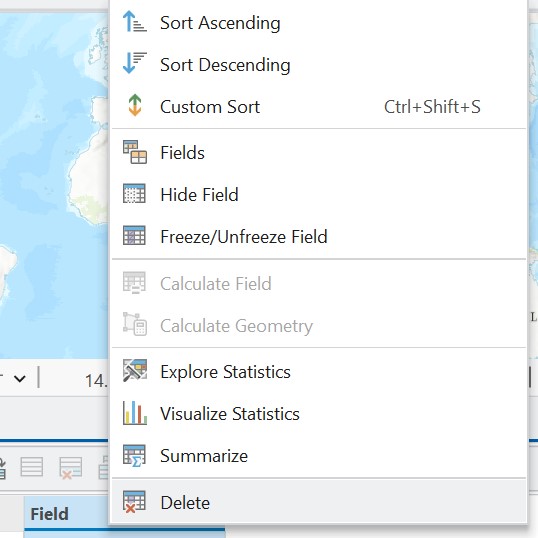
To delete a field, right-click the column header and select Delete Field.
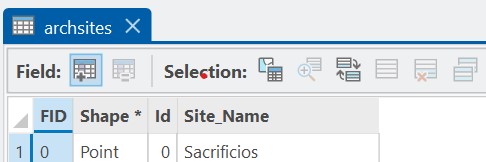
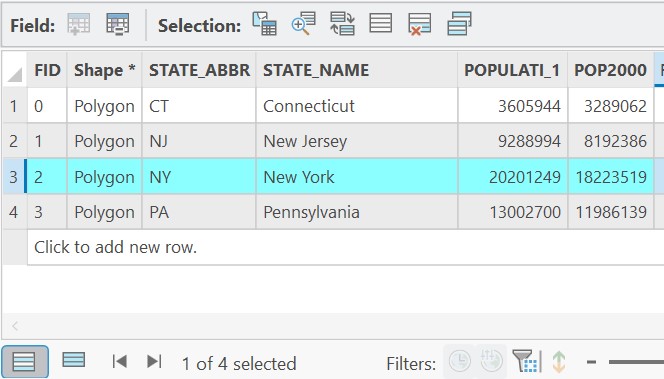
You can select a specific record or row by clicking the number of the row at the far left of the table. In the following table, row 3 (New York) has been selected. Note at the bottom of the table the caption that states 1 of 4 selected.
Double-clicking a row will zoom to that selection. The various options at the top of the table and next to Selection offer several options, including Switch Selection (which selects all records that were previously not selected), Clear Selection (which will unselect all), and Delete Selection (which will delete the selection). Note that anything deleted cannot be undone. Some of these options are also available under the Edit toolbar -> Selection.
To populate values in the new field or to change values in an existing field, double-click the relevant cell and type the appropriate value.
The Calculate Field option, available above the table, is useful to perform arithmetic operations on numeric data or to edit multiple records at once.
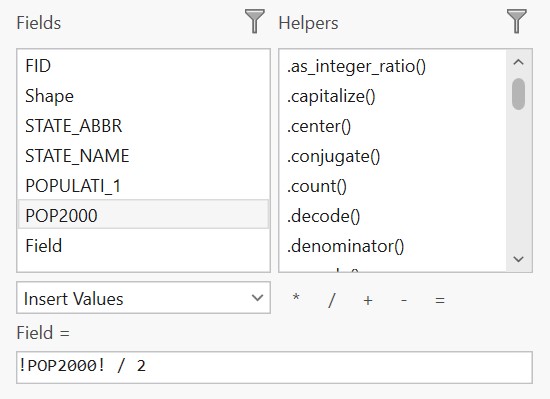
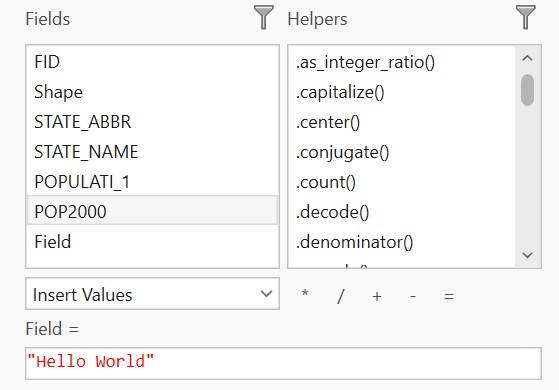
First, select a record, click Calculate Field, and in the new window enter an operation under Field = . For example, the following operation will populate the “Field” column with values that are equal to half of the POP2000 column.
Alternatively, if your data are not numeric but text instead, you can calculate the cell to contain a string of text, contained within single or double quotations:
To add records or rows to attribute tables, refer to the following section on Editing Vector Data.
Tips for Working with Tables in Excel#
Often, editing tables in Excel is easier than in ArcGIS Pro. For a list of functions, refer to the following link.
To add a function to a column in Excel, click on a cell and type =, followed by your function and parentheses.
To add all of the rows from A1 to E1, type in the F1 cell the following:
=SUM(A1:E1)
To copy this same function to all rows, copy the F1 cell, highlight the desired rows starting with F2, and paste.
These cells will continue to update if you go back and edit any of the previous columns. If you want to just save the values and not the functions, highlight the relevant cells, copy, and right-click Paste Values (the icon with a clipboard and 123).
To select the right three values from the A1 cell, use the following:
=RIGHT(A1,3)
To select the left two values from the A1 cell, use the following:
=LEFT(A1,2)
To select the middle two values from the A1 cell starting with the third value, use the following:
=MID(A1,3,2)
The spreadsheet must be saved as a comma-separate value, or .csv file. This file can then be imported into ArcGIS Pro as a standalone table using the Add Data button.