Loading and Visualizing Data#
Loading Data in ArcGIS Pro#
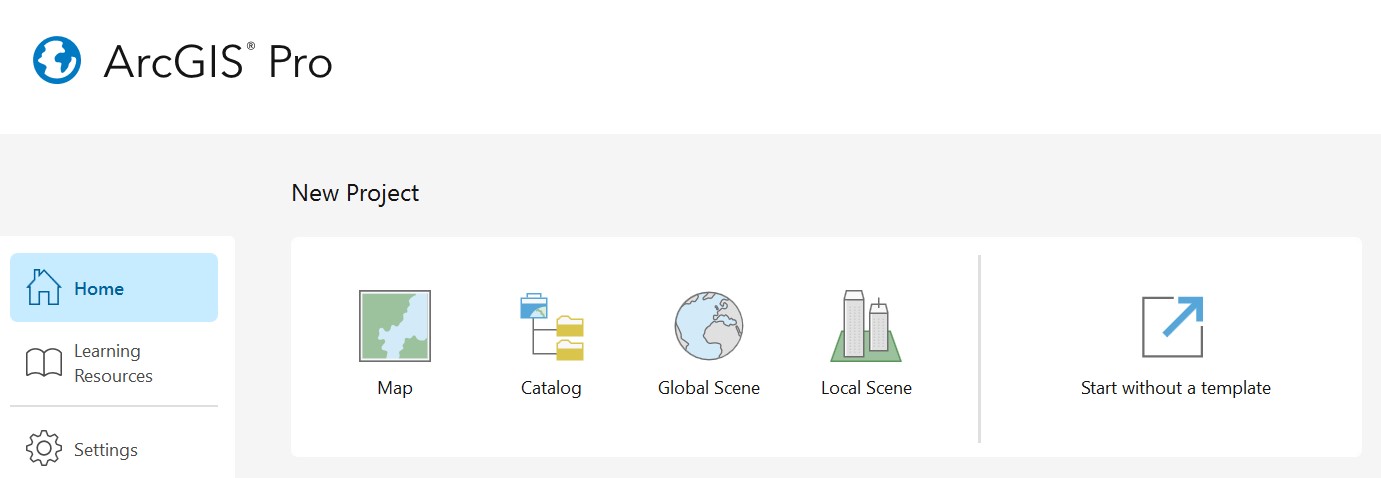
Once signed in, create a new project by clicking Map.
Select the name and a folder location for your project. If the option is selected (by default), a new folder will be created in your selected folder location with the same name as your project – this is the recommended folder structure.

Your main window for ArcGIS Pro should open, showing a map view, Contents, and either a Catalog or Geoprocessing window.
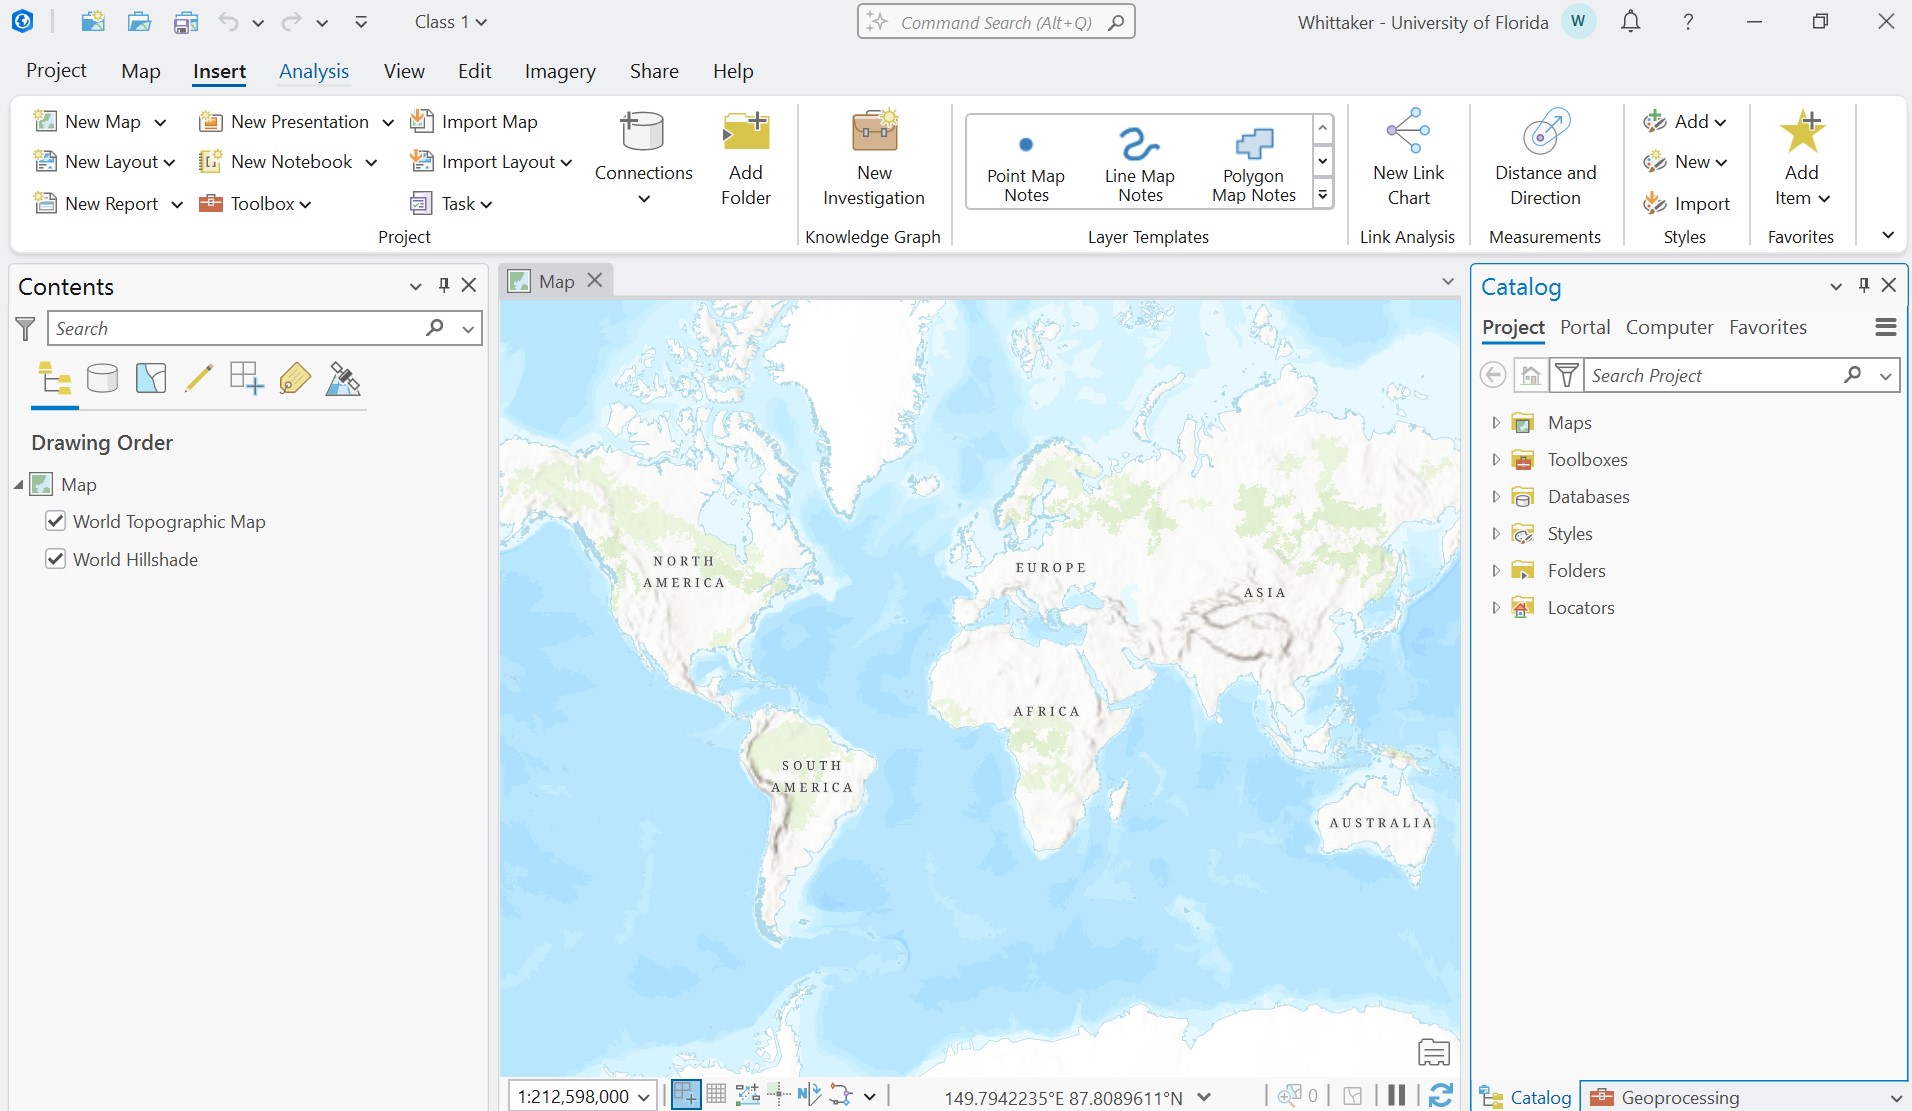
If you do not see the Contents, Catalog, or Geoprocessing panes, they can be added under View -> Windows. You can exit out of existing panes by clicking the X, or by clicking the thumbtack, you can pin the pane to the side, or lock it to its current location.
In your File Explorer, you should see a folder structure similar to the following:
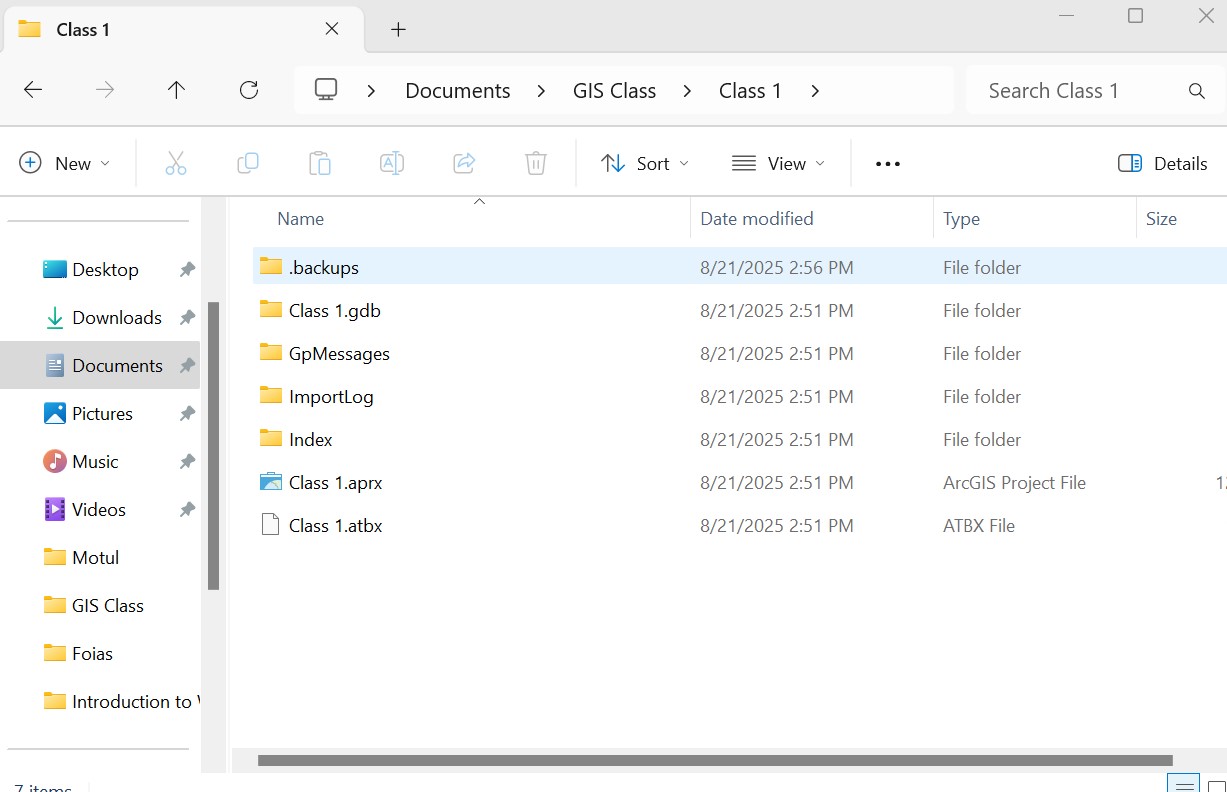
Inside your project folder, you will see an .aprx file. This is your project file, which you can open directly to access your project in ArcGIS Pro. You will also see a folder with a .gdb extension. This is your project’s default geodatabase. You can choose to organize your files in this geodatabase or in your project’s main folder.
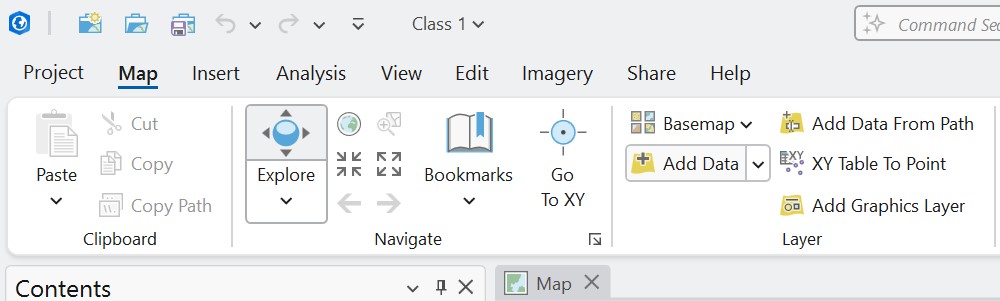
In the ArcGIS Pro main window, to change the Basemap, select the option under Map -> Layer -> Basemap.
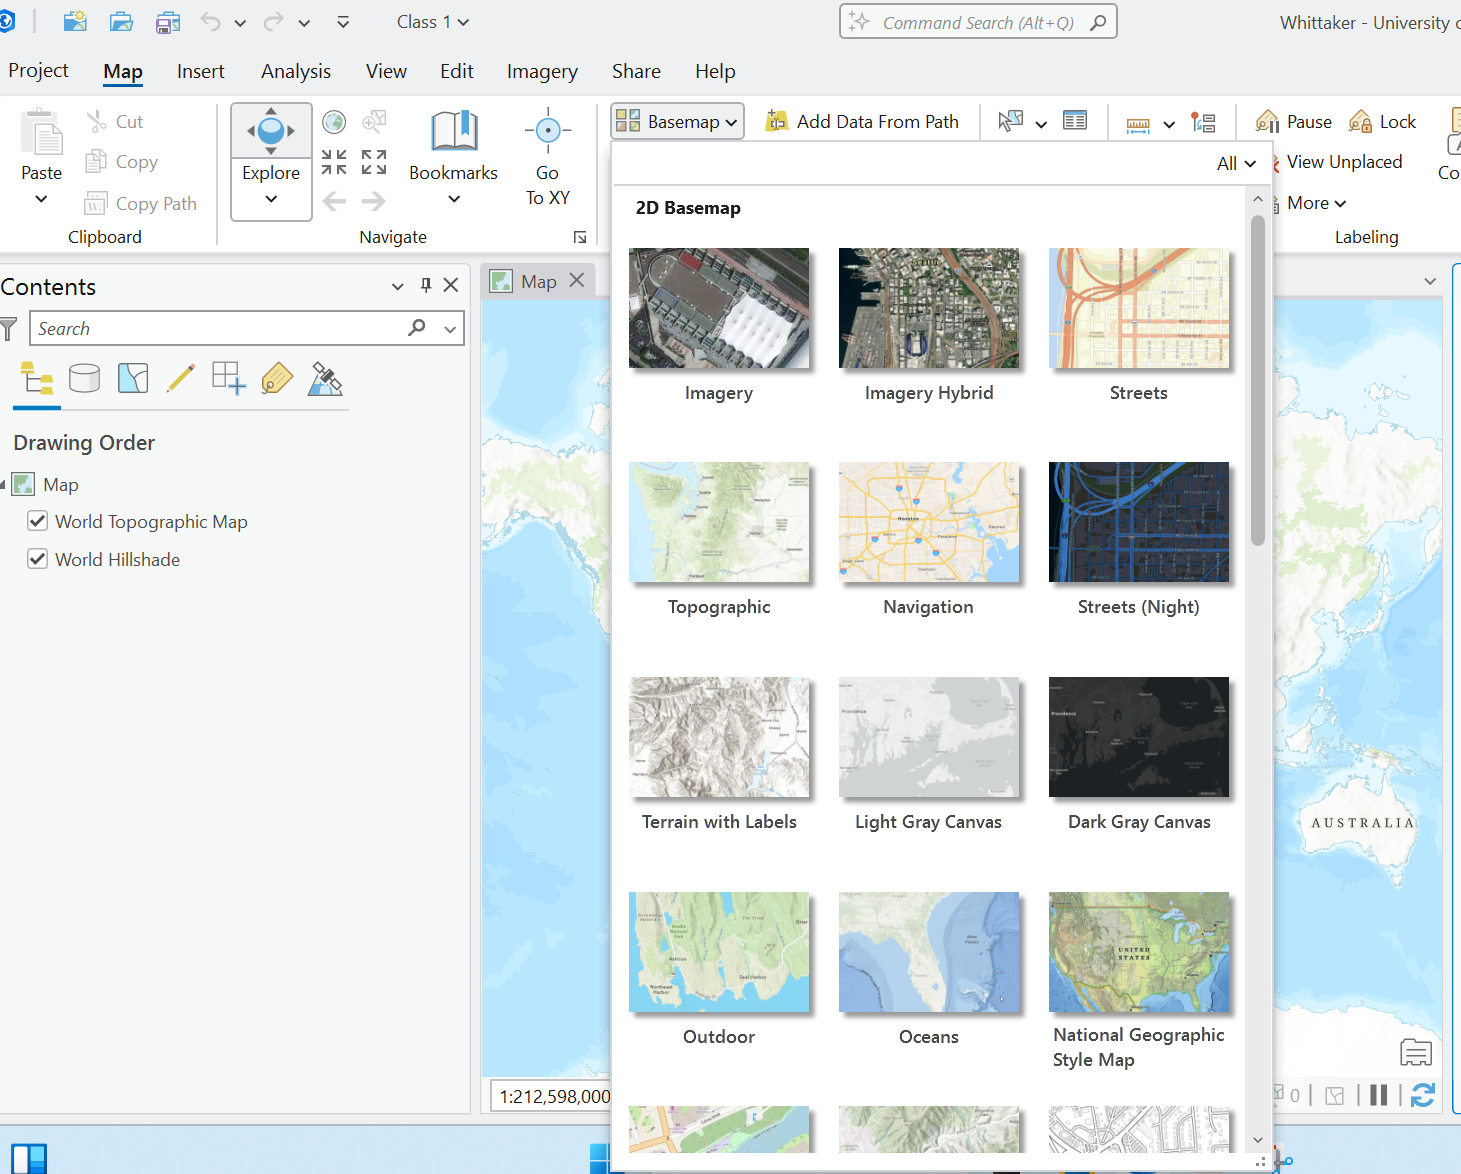
The text in the Contents window will update when changing the Basemap. The items listed here are the layers in your GIS. You can turn them on or off by clicking the check box, and you can reorder them by clicking and dragging a layer above or below another one. Higher layers will be displayed above lower layers.
To add your own data, click Map -> Layer -> Add Data.
Navigate to your data (if you don’t see your data you might need to click the refresh button.
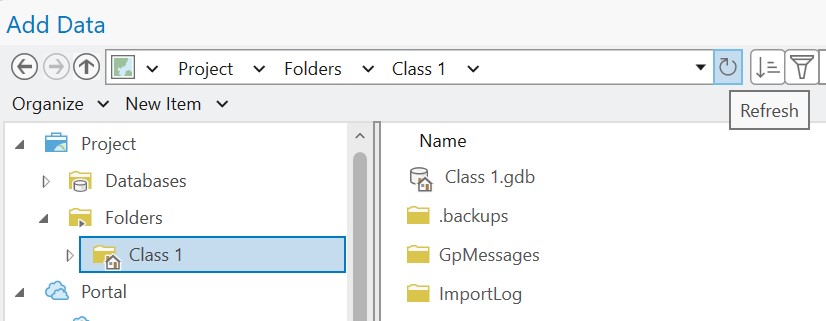
The Contents pane should now populate with additional layers, and the map should automatically zoom to the extent of your data.
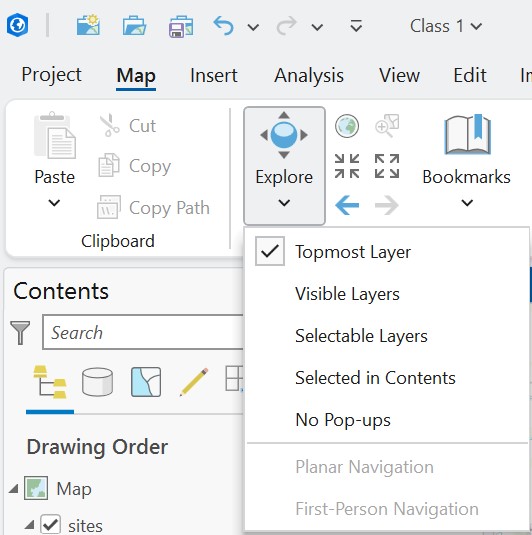
You can navigate across the map by clicking Map -> Navigate -> Explore, clicking, holding, and dragging areas in the map to pan. If you click an area of the map quickly without dragging, you will engage the Pop-up identify tool, which will identify information about that specific layer and location. To turn off this function, click the dropdown arrow and select No Pop-ups. To zoom in and out, use your mouse or touch pad, or use the Fixed Zoom In and Fixed Zoom Out buttons under Map -> Navigate. Hold shift to draw a box to zoom to that area. Right-click a layer in the Contents and click Zoom to Layer to zoom to its extent.
To alter the symbology of your data, right-click on any layer in the Contents and select Symbology. A Symbology pane should open. For point, line, and polygon data, click on the Symbol to change the color and size of the marker. For imagery, click through the different Color Schemes. For elevation data, change Stretch to Shaded Relief.
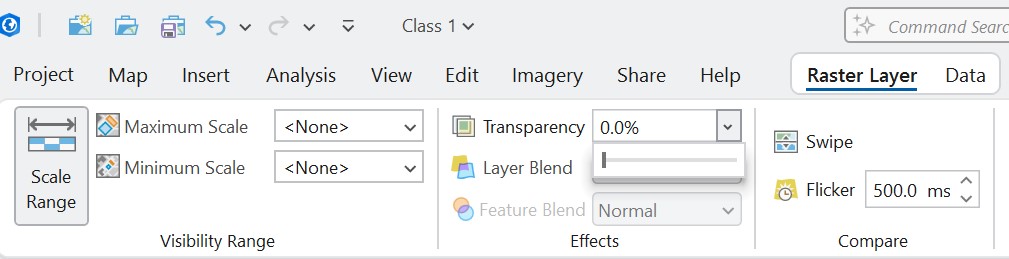
To change the transparency of a layer, select it in the Contents, and click either Feature Layer or Raster Layer, depending on data type, and change the Transparency from 0% to a higher value.
Loading Data in QGIS#
To create a project in QGIS, you can start by loading data, then clicking Save Project at the top left, or click Project -> New, then Save Project. Navigate to your project folder, and save. Doing so will create a .qgz file, which will be your project file.
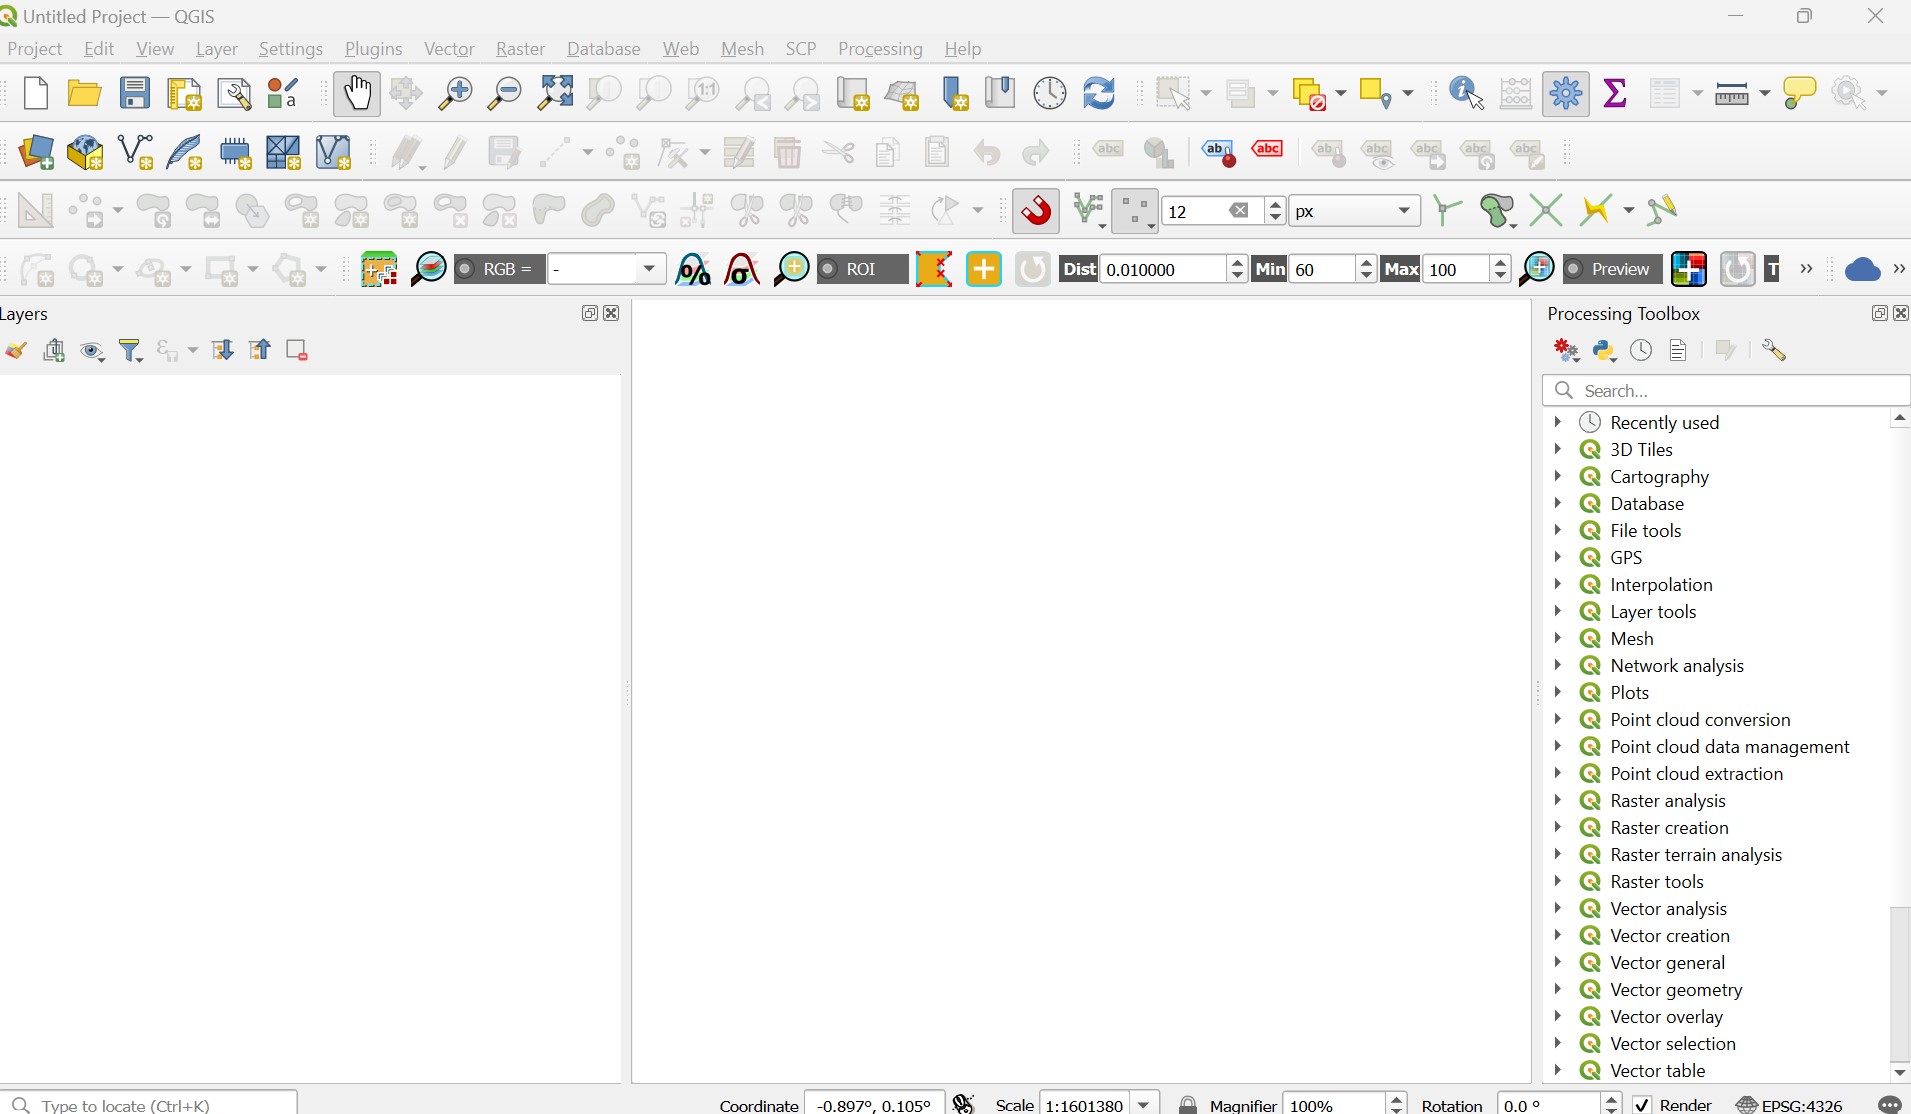
To the left, you should see your Layers panel and to the right, your Processing Toolbox. If not visible, these panels can be turned on under View -> Panels.
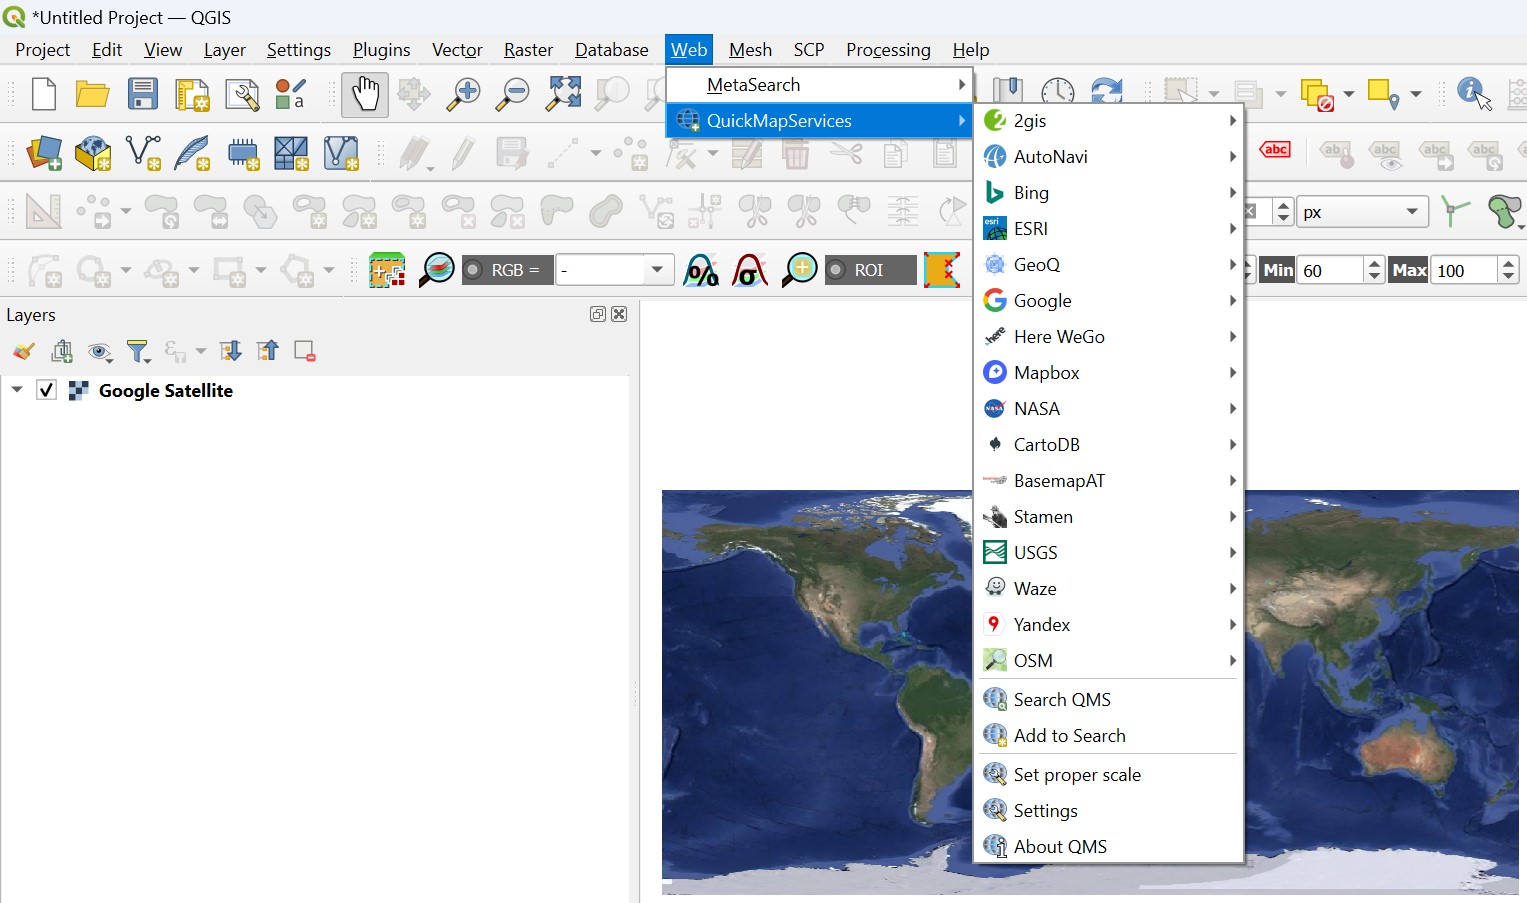
QGIS does not have built-in basemaps. You will instead have to install a plugin called Quick Map Services. Go to Plugins -> Manage and Install Plugins. In the window, click All, and in the search bar, type QuickMapServices. Click on the name of the plugin, and click Install. Once installed, you might need to restart QGIS. The plugin will then be available under Web -> QuickMapServices with several available basemaps, including Google Satellite.
The text in the Layers panel will update when changing the basemap. The items listed here are the layers in your GIS. You can turn them on or off by clicking the check box, and you can reorder them by clicking and dragging a layer above or below another one. Higher layers will be displayed above lower layers.
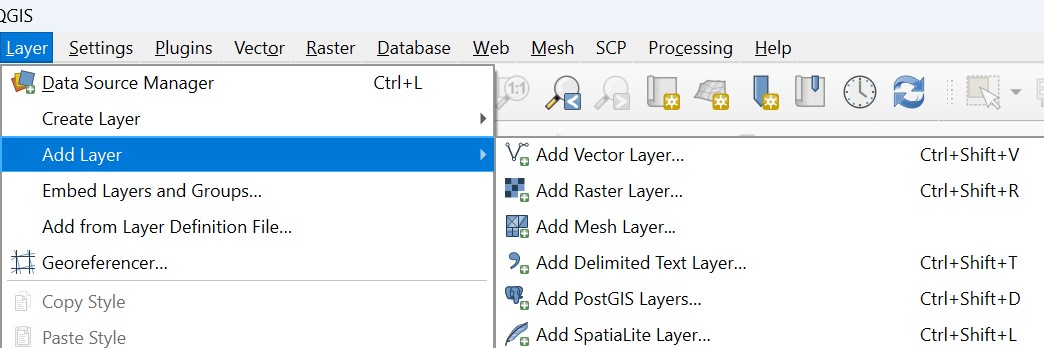
To add your own data in QGIS, you have to specify the type of data. Click Layer -> Add Layer, then either Add Vector Layer or Add Raster Layer. Raster data includes imagery, while vector data represent point, lines, and polygons. In the Data Source Manager, under Source click the three dots to navigate to your file then click Add.
You can navigate across your map with the Pan Map or “hand” icon.

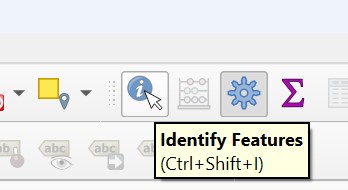
The Identify Features tool can be used to click a specific location associated with a layer to identify it.
To zoom in and out, use your mouse or touch pad, or use the Zoom In and Zoom Out buttons. A single click will zoom at a fixed scale, and drawing a box will zoom in to that region. Right-click a layer in the Contents and click Zoom to Layer(s) to zoom to its extent.
To alter the symbology of your data, right-click on any layer in the Layers panel and select Properties. Click the Symbology icon at the left. For point, line, and polygon data, the color, size, and style of the marker can be changed. For imagery, choose under Render type, Singleband gray or Singleband pseudocolor for options. For elevation data, click Hillshade. You might need to change the Z factor to 0.00001 depending on the coordinate system of the data. To change the transparency, click the Transparency menu at the far left. Change the Global Opacity to a value under 100%. Click Apply and OK.