Interpolation and Density#
Often discussed together, interpolation and density tools are actually distinct approaches to generating a continuous surface from sample data points.
Density#
The density tools should only be applied to discrete point data that represents a specific occurrence of some phenomenon; for example, artifacts documented on an archaeological surface survey. In such a case, each point represents a frequency of the occurrence of data, or number of artifacts. In this scenario, the presence of an artifact in one location does not necessarily influence the presence of an artifact nearby. The density tools will therefore not make up locations of samples but rather generate a surface that shows “hot spots” of higher vs. lower frequencies.
Density can be visualized in several ways. The Point Density tool will calculate the number of samples within a specified radius or neighborhood (typically a circle). If each point represents a single occurrence of a phenomenon (e.g., a single artifact), the Population field can be blank. However, if each point contains a field representing a count of the phenomenon (e.g., multiple artifacts at one point), the Population field can be updated to include this value. The output will be several circles (or other shapes dependent on the type of Neighborhood selected) with colors assigned to those with higher counts/densities of point data. Three dimensionally, this surface would look like several overlapping cylinders whose heights reflect the point density.
The Kernel Density tool is similar to point density; however, the defined radius is known as a kernel, bandwidth, or bin that determines how density will be visualized. In ArcGIS Pro, this kernel is defined with the Search radius parameter. This parameter can significantly affect the results of the density analysis. If left blank, a default value will be calculated using Silverman’s Rule of Thumb. Based on the distribution of the data, this approach is not always the appropriate one. Best practice is to run the kernel density analysis with several different parameters. The output from the kernel density tool is smoother than that of the point density tool, and if visualized three dimensionally would represent mounded features rather than cylinders.
Interpolation#
The interpolation tools, in contrast to the density tools, should be used on continuous data, where values are sampled at specified points. Interpolation assumes that values will be most similar to the closest values and more different from the farthest values. In other words, in contrast to the density tools, the interpolation tools assume that the value of sample data in one place will influence the values of nearby points. The interpolation tools also differ from the density tools in that a Z value field is required, which in terrain analysis represents the elevation of point data. Several interpolation approaches are available in ArcGIS Pro under the Interpolation tools in the Geoprocessing toolbox.
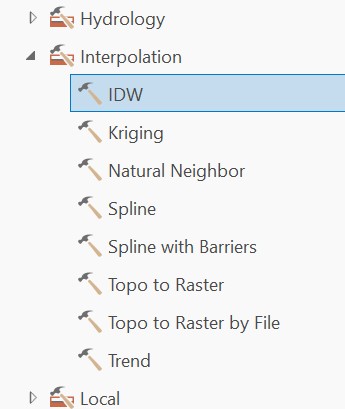
The IDW tool conducts an interpolation based on Inverse Distance Weighting. The Power parameter will determine how strongly nearby points affect the interpolated value. Higher powers will assign less influence from more distance points.
The Kriging tool provides a geostatistical technique to interpolation. This tool will also optionally output a variance of prediction raster that includes error values. The Empirical Bayesian Kriging tool is a more advanced application of this technique.
The Natural Neighbor tool is the simplest approach to interpolation. This tool should generally be reserved only for modelling flat areas with minimal topographic variation.
The Spline tool uses a two-dimensional minimum curvature spline technique that constrains the resulting surface to pass through the sample points. The Spline with Barriers tool conducts a spline interpolation within a barrier feature class (polyline or polygon) to remove edge effects.
Note that edge effects can be removed from any of these approaches by using the Clip Raster tool on the output raster with an input polygon.